
Overview
Following a relatively quiet August, September brought a surge of volatility and strong directional moves, largely driven by pivotal macroeconomic and monetary policy developments in the United States.
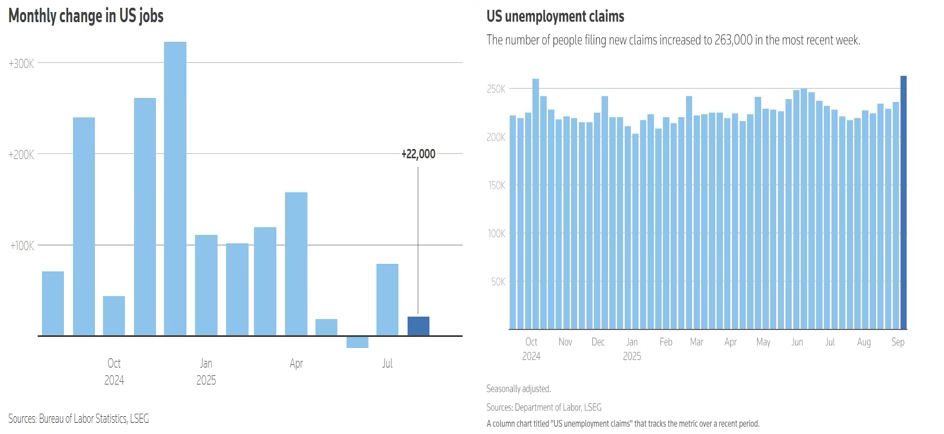
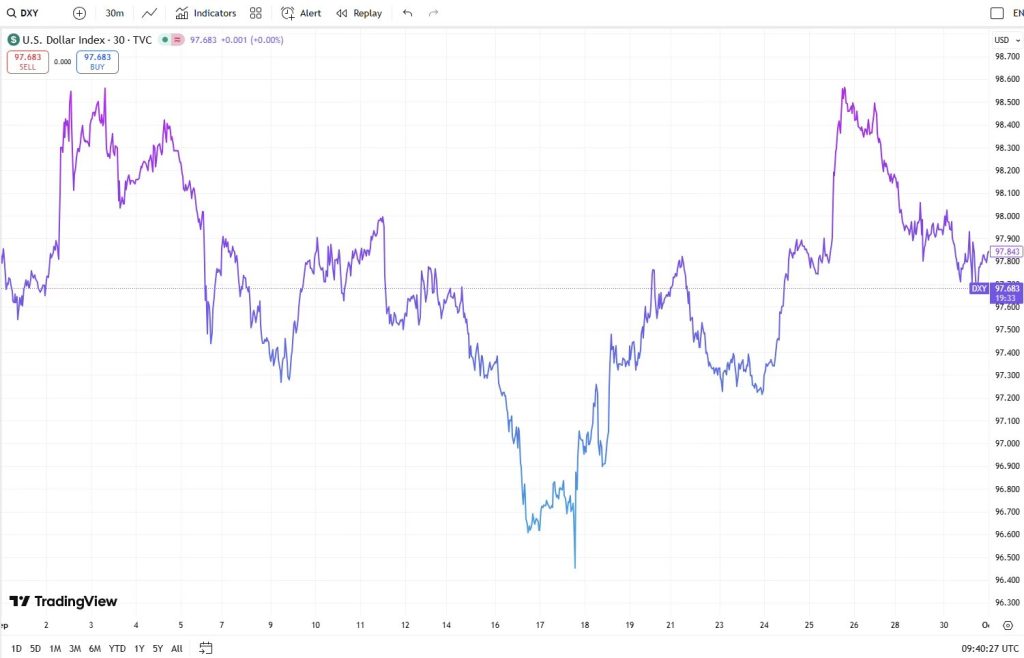
The month was action-packed with a constant stream of market-moving data releases and policy actions that collectively shaped the trajectory of the US dollar and other key currency pairs. The dollar’s initial run in September, however, was defensive. On September 5, the Bureau of Labor Statistics delivered a significant surprise: nonfarm payrolls had increased by only 22,000 in August. This was a dramatic slowdown compared to earlier in the year and fell noticeably short of the 75,000 forecast. Simultaneously, the unemployment rate climbed to 4.3%, its highest point in nearly three years.
This weak report immediately sparked a US dollar sell-off as markets concluded the Federal Reserve would be compelled to ease policy sooner than anticipated. The evidence of a softening labor market continued a week later, when a subsequent report showed initial claims for state unemployment benefits jumped by 27,000 to a seasonally adjusted 263,000 for the week ended September 6—the highest level recorded since October 2021.
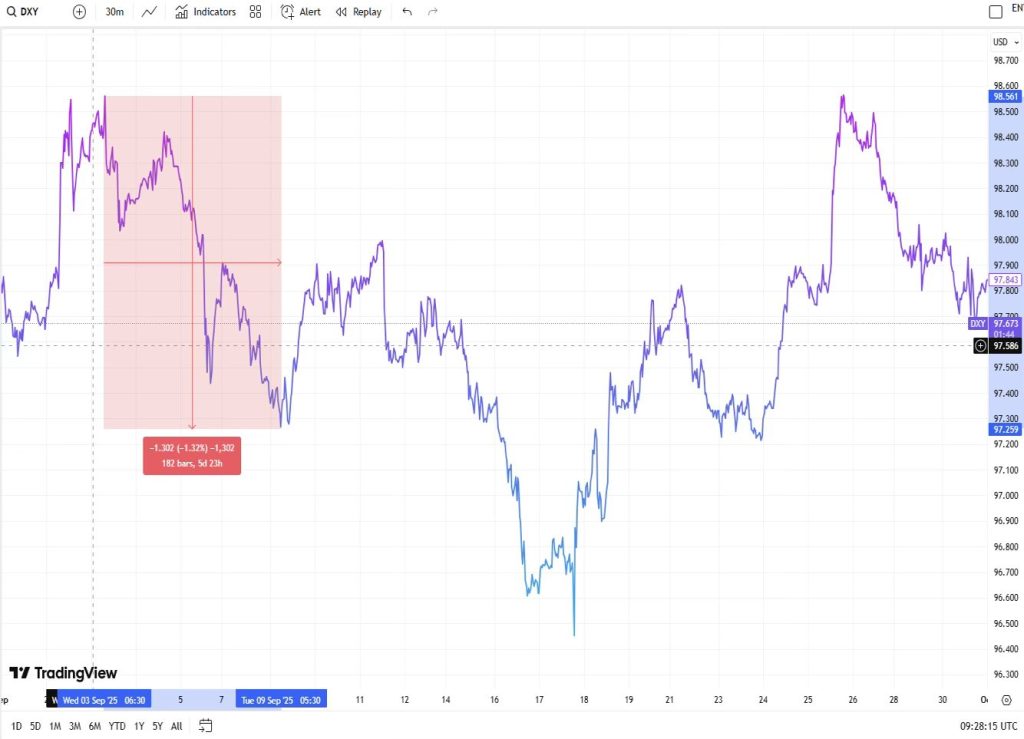
The blow from the two weak labor reports immediately deflated the US dollar index, which surrendered 1.32% of its value between September 3 and 9.
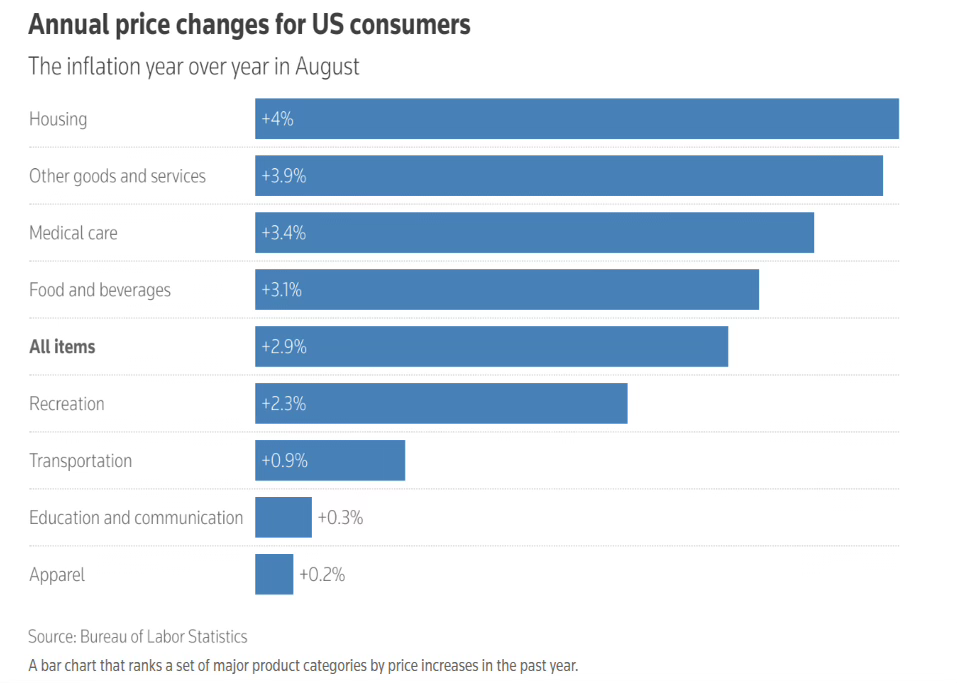
A twist nearly emerged on September 11 with the release of the latest inflation data. It showed US consumer prices had risen at their fastest pace in seven months during August, primarily driven by higher costs for both housing and food. The August Consumer Price Index (CPI) advanced by a seasonally adjusted 0.4%, doubling the 0.2% increase recorded in July. Over the twelve months ending in August, the CPI saw a 2.9% increase, marking the largest annual jump since January, up from 2.7% in July.
Despite this surprising—and for some, shocking—acceleration in inflation, the earlier signs of a softening labor market kept expectations for an imminent Fed rate cut firmly intact. As a result, the dollar fell to a multi-year low just before the Federal Reserve’s September 17 meeting. Ahead of the announcement, markets were fully primed for a staunchly dovish Fed that would be eager to hasten its easing cycle, with some analysts even speculating about a 50 basis point reduction.
The anticipation of a deeper slide down the rate curve was widespread and infectious. However, in the background, the combination of elevated inflation and weakening employment conditions was simultaneously fueling fears of stagflation and presenting the US central bank with a complex dilemma that extended well beyond the anticipated rate decision. On the decisive day, September 17, the Fed implemented its first cut of the year, reducing the policy rate by 25 basis points to a new range of 4.00%−4.25%, an action that explicitly acknowledged the perceived softness in the labor market.
Immediately following the Fed’s decision, the dollar staged a significant rebound as investors quickly reassessed the central bank’s tone and pared back their overly aggressive rate cut expectations. This was primarily because the Fed had delivered a “hawkish” cut; Chair Jerome Powell emphasized that all future decisions would hinge on incoming data, offering no guarantee of a rapid easing cycle.
Furthermore, the Fed’s updated dot plot and forward guidance signaled a much more gradual path, projecting only two additional rate cuts for the remainder of 2025, rather than the rapid descent the market had anticipated. This clear message of a gradual easing cycle provided strong support, enabling the dollar to rally forcefully.
That rally, which began on September 17, was further fueled by a series of upbeat macroeconomic releases that underscored the resilience of the US economy. The Labor Department, for instance, reported that jobless claims dropped by 14,000 to 218,000 for the week ending September 20, easily beating the 235,000 forecast. Consumer spending, which accounts for more than two-thirds of US economic activity, rose 0.6% in August, surpassing the 0.5% estimate. Most importantly, second-quarter GDP growth was revised sharply upward to 3.8%, easily beating expectations.
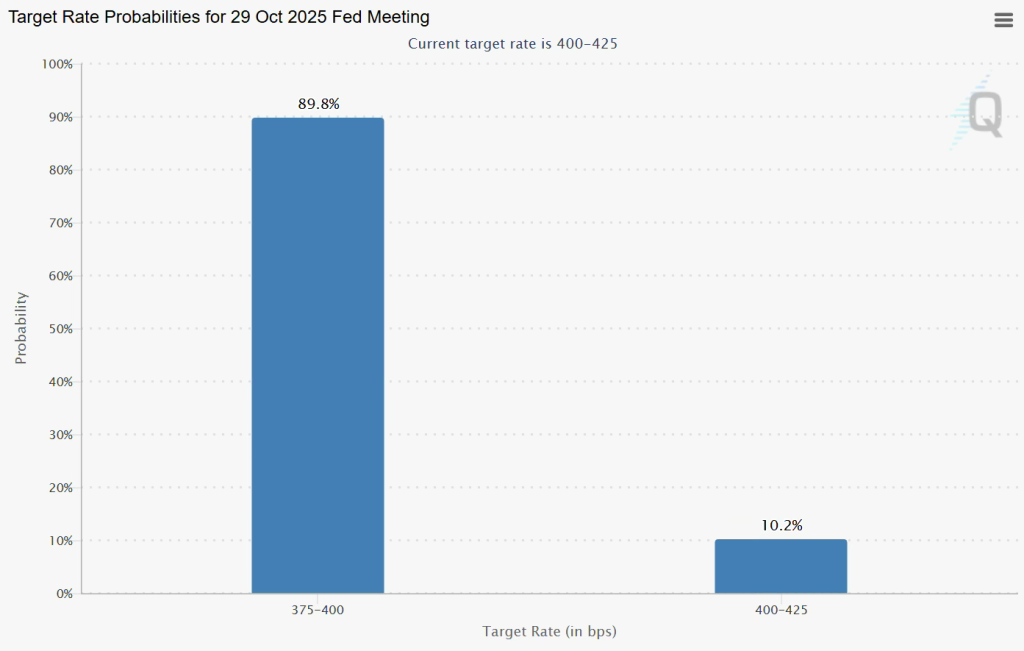
This unexpectedly strong data complicated the Fed’s policy outlook, softening the market’s previous certainty of cuts at the two remaining 2025 meetings. As a reflection of this uncertainty, traders are now pricing an 89.8% chance of a 25 basis point cut at the next meeting, down from nearly 92% just one week prior, according to the CME’s FedWatch tool.
By the close of September, the US dollar found itself retreating once again, this time driven by escalating concerns over a potential US government shutdown. Investors began selling the USD amid growing worries that the US administration would fail to secure continued funding before the September 30 deadline, the final day of the 2025 fiscal year.
This late-month descent served as a perfect encapsulation of the Greenback’s erratic and wobbly price action throughout the high-voltage month of September.
At this point, we would typically move to analyze the price action of key currency pairs like EURUSD, GBPUSD, and XAUUSD (Gold). However, given the extraordinary moves in AUDCAD and AUDNZD and their significant impact on our P&L throughout September, we feel it is more relevant to examine these crosses before turning to the major pairs.
Both AUDCAD and AUDNZD experienced powerful directional trends in September, though each followed its own distinct path.
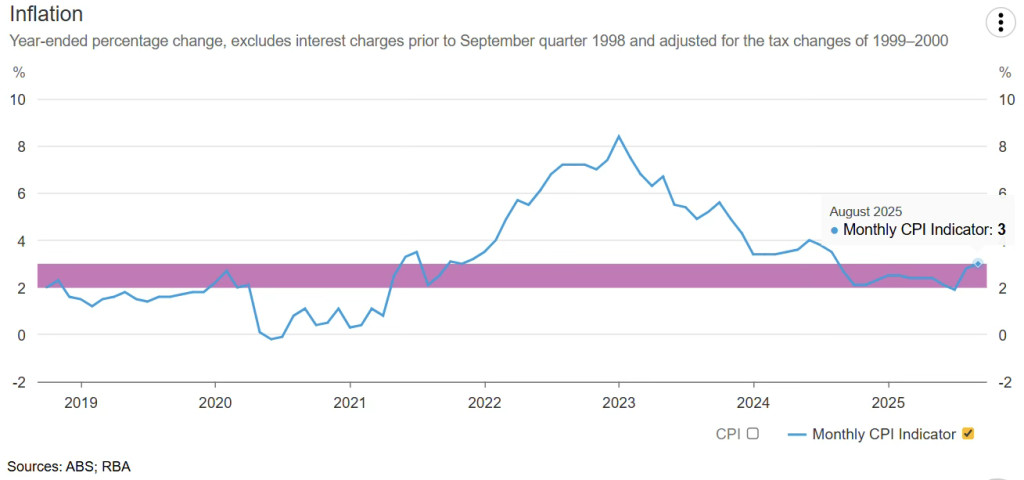
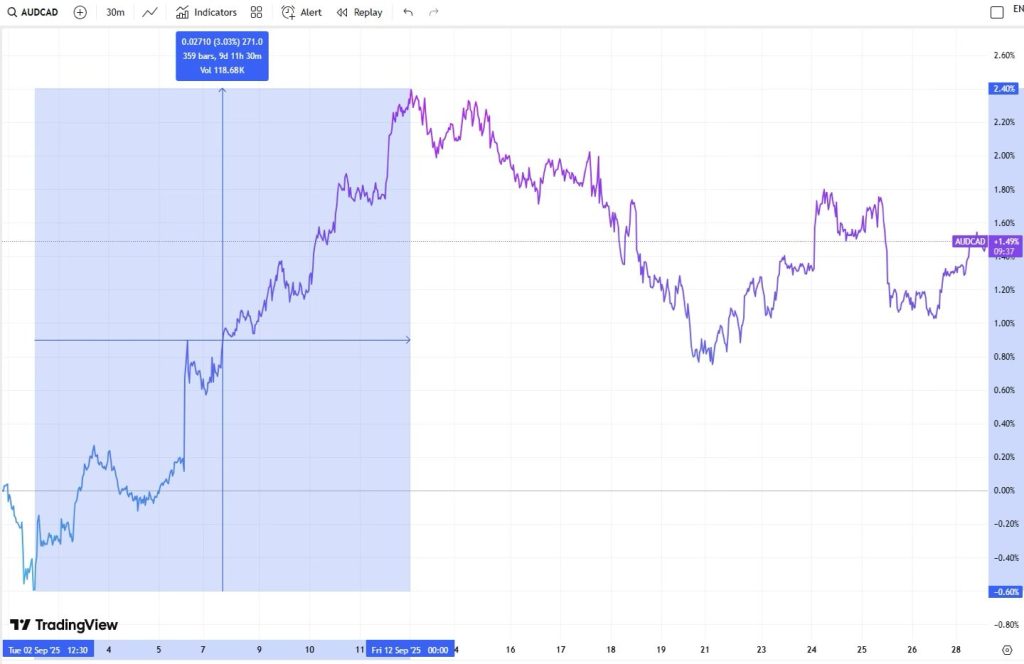
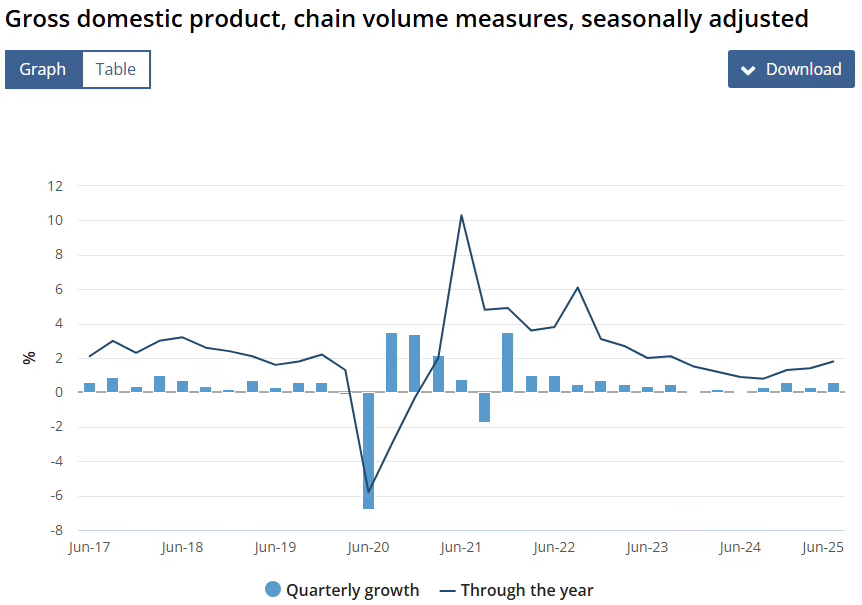
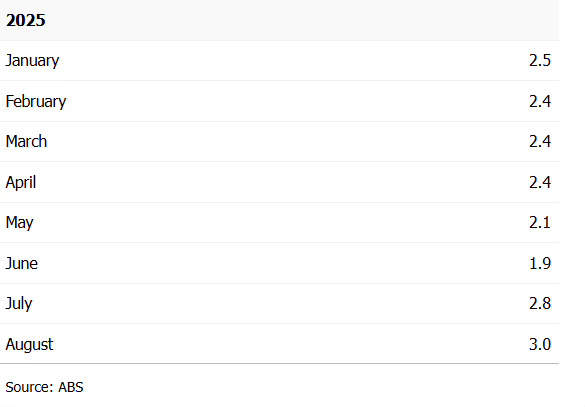
AUDCAD spent the first half of the month trending higher, bolstered by underlying strength in the Australian dollar (AUD). The Australian economy showed notable resilience in the second quarter, with GDP climbing 0.6% quarter-on-quarter and 1.8% year-on-year. Furthermore, August’s hotter-than-expected CPI print of 3%—up from 2.8% in July and 1.9% in June—reinforced market expectations that the RBA would hold its rate at the September 30 meeting, providing a strong lift to the AUD.
The pair reached its high of around 0.9227 on September 12, after which it settled into a horizontal trading range until September 17.
Between September 17 and 22, the pair moved lower as several factors put pressure on the AUD, while the CAD received a modest boost. On September 18, the Australian labor survey revealed that employment dropped by 5,400 in August, sharply missing the forecast for a 21,500 gain, with full-time positions plummeting by nearly 41,000.
Moreover, after the Aussie dollar reached a 10-month high early in the month, investors engaged in profit-taking and adopted a more cautious stance ahead of the US Federal Reserve meeting. Generally heightened risk aversion across markets also served to dampen demand for higher-beta currencies such as the AUD.
Meanwhile, the Canadian dollar found support as oil prices began to tick higher due to fears of potential supply disruptions—oil being a major Canadian export—allowing the CAD to briefly strengthen to its best level since September 1.
Ultimately, the combination of disappointing Australian data and the Fed’s easing action, which strengthened the USD, maintained downward pressure on AUDCAD throughout this period.
In late September, AUDCAD reversed course and pivoted higher again as the consensus solidified that the Reserve Bank of Australia (RBA) would maintain its current rate. ASX futures implied only a slim chance of a cut, as most investors expected the central bank to wait for the Q3 CPI report scheduled for late October.
While the Aussie dollar was finding support, the Canadian dollar struggled due to wider US–Canada yield spreads, softer risk appetite, and a broad rally in the US dollar. The Canadian 2-year yield was trading 114 basis points below its U.S. counterpart, a spread that had widened from 92 basis points at the end of August. Investors typically favor the currency offering the higher yield.
Consequently, AUDCAD trended upward in late September, with the Aussie demonstrating relative resilience against the Canadian dollar—though the magnitude of this move was less pronounced than the rally seen earlier in the month.
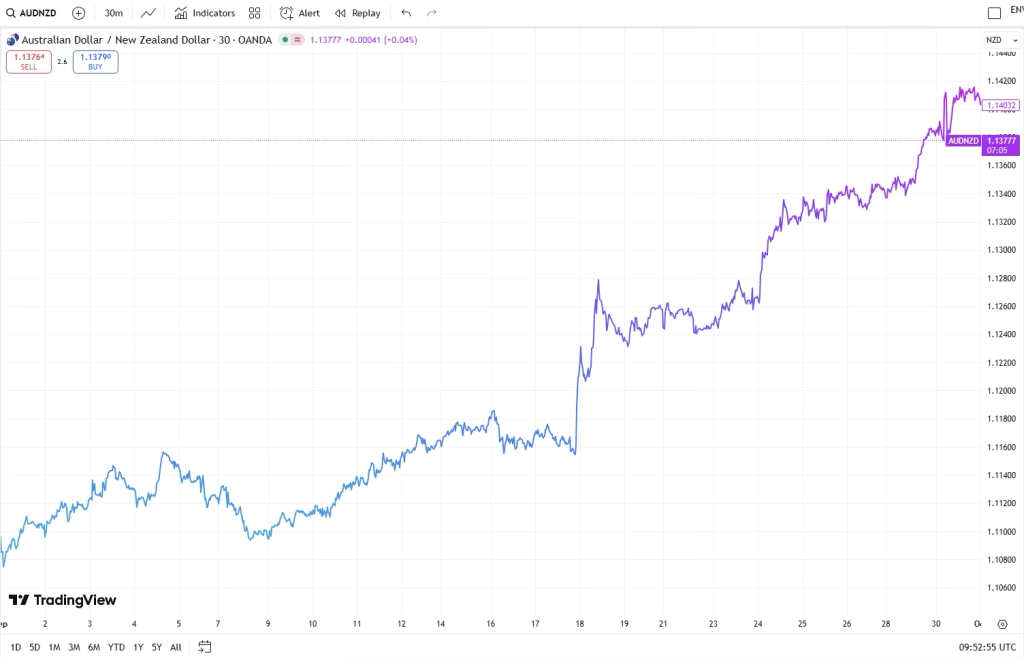
AUDNZD, however, presented a completely different narrative for September. Unlike cryptocurrency markets, where erratic price behavior is the norm, the forex market typically exhibits less dramatic moves. Despite this, AUDNZD caught markets by surprise with an unbroken run higher. By the end of the month, the pair’s daily Relative Strength Index (RSI) was trading at its highest daily levels on record.
The month began with a distinctly dovish stance from the Reserve Bank of New Zealand (RBNZ), following their August 20 decision to cut the cash rate by 25 basis points, lowering it to a three-year low of 3.00%. In fact, two committee members had advocated for an even larger 50 basis point cut, and the central bank indicated that further easing was likely as policymakers voiced concerns over both domestic and international growth headwinds.
Meanwhile, the Aussie dollar gained ground as a consensus formed around the idea that the RBA would hold rates at its late-September meeting, a view reinforced by economic data suggesting resilience. The 0.6% rise in Q2 GDP notably underscored this underlying strength.
This dramatic difference in economic health and central bank policy outlooks caused the NZD to tumble while the AUD remained firm, effectively fueling the AUDNZD rally throughout the first half of the month.
Mid-September further compounded the NZD’s troubles when official data revealed that New Zealand’s GDP had contracted by 0.9% in the second quarter, a figure significantly worse than the 0.3% decline forecast by both analysts and the Reserve Bank of New Zealand itself.
Following the release, the NZ dollar dropped 0.5%, with markets quickly pricing in approximately 58 basis points of additional cuts to the cash rate and assigning a 20% probability to a 50 basis point cut by the central bank in October. This immediately accelerated the AUDNZD rally, propelling it to levels not witnessed since late 2022.
The final week of September delivered the month’s sharpest move, seeing the Aussie climb by as much as 0.3% to 1.1303 per kiwi—its highest point since October 2022. This jump was triggered by data showing August CPI had risen 3% year-on-year (as previously noted), marking the fastest increase in a year and strengthening the expectation that the RBA would hold rates steady at its September 30 meeting.
By the close of September, the Aussie dollar was headed toward nine consecutive weekly gains against the kiwi, marking its longest winning streak since 1998.
While the analysis of the previous two pairs (AUDCAD and AUDNZD) was heavily influenced by unique, country-specific factors alongside US developments, the price action in major pairs like EURUSD, GBPUSD, and Gold (XAUUSD) was primarily dictated by movements in the US dollar.
The first half of September witnessed the EURUSD rally, propelled by consecutive weak US labor market reports signaling an economic slowdown. As detailed previously, the Nonfarm Payrolls (NFP) release in the first week showed August payrolls increasing by a meager 22,000 and unemployment rising to 4.3%. This was quickly followed by another report showing initial jobless claims soaring by 27,000 to a seasonally adjusted 263,000 for the week ending September 6—the highest figure since October 2021. The resulting dollar plunge drove the pair higher between September 2 and 9.
On September 11, the European Central Bank (ECB) held rates steady, as widely anticipated by the markets. The accompanying policy statement stressed that inflation was currently near the 2% target and that the economic outlook remained “broadly unchanged.”
The crucial turn came on September 17, when the Fed’s delivery of a “hawkish” rate cut took markets by surprise. Over the next day, the dollar staged a powerful rebound as investors reevaluated the Federal Reserve’s communication and sharply reduced their expectations for aggressive future rate cuts.
A subsequent series of positive US economic data further boosted the dollar. Jobless claims fell by 14,000 to 218,000 for the week ended September 20, substantially below the 235,000 forecast. Consumer spending, which accounts for over two-thirds of US activity, rose 0.6% in August, topping the 0.5% estimate.
Most significantly, second-quarter GDP was revised upward to 3.8%, surpassing estimates and highlighting the economy’s enduring resilience. The combined force of all these factors served to reinforce the Greenback, driving EURUSD into a downward trend between September 17 and 25.
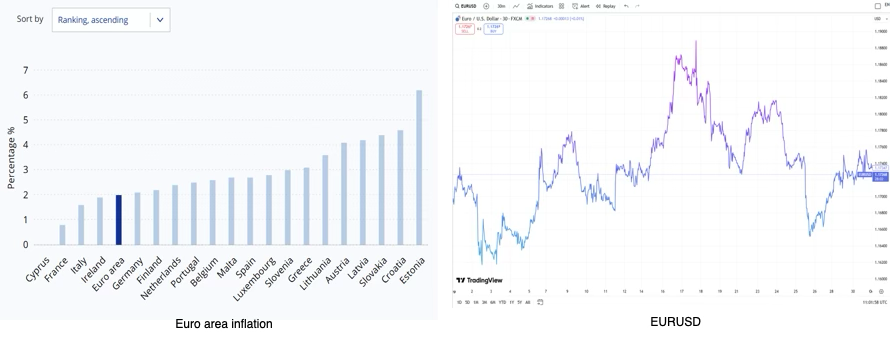
Toward the end of September, the dollar returned to a state of pressure, as investors divested the reserve currency due to increasing apprehension that the US administration might not be able to prevent a government shutdown past the September 30 fiscal deadline. Against this scenario, the EURUSD pair rallied from September 25 onward, ultimately concluding the month near 1.17.
GBPUSD tracked a similar trajectory to EURUSD, but with greater volatility, as detrimental UK-specific issues imposed additional strain on the pair throughout September.
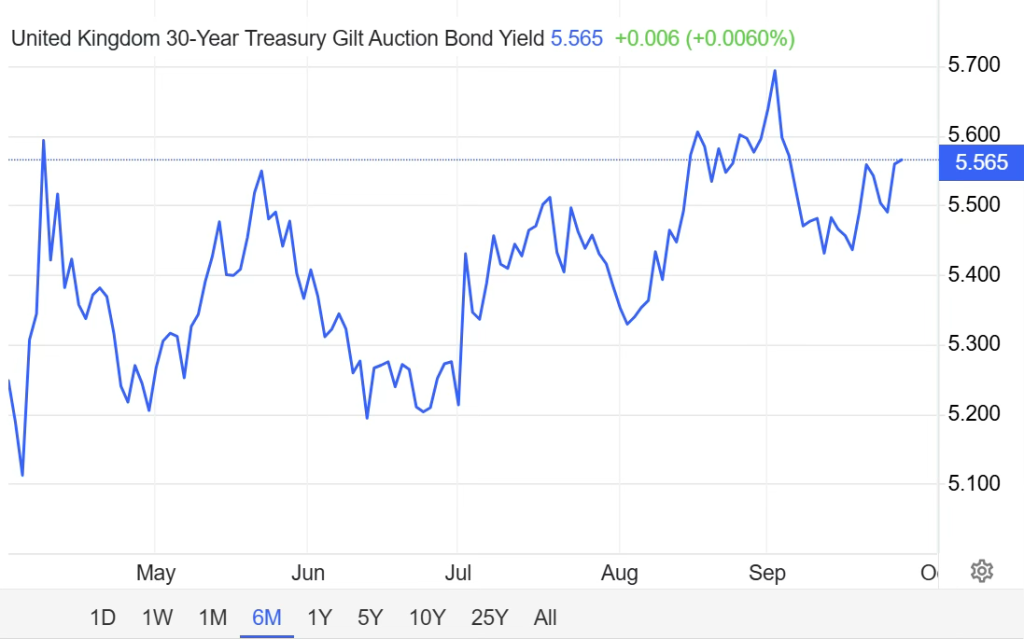
The pair exhibited instability early in the month, stemming from investor anxieties regarding Britain’s public finances and the government’s capacity to manage them, which also sent tremors through the bond market. Specifically, the yield on the UK’s 30-year gilt surged to 5.747% on September 3, marking its highest level since 1998. While rising yields typically favor the pound, when they are driven by fears of inflation instead of optimistic growth prospects, they tend to have a detrimental effect on the currency.
Following this initial turbulence, GBPUSD began to trend upward, supported by the string of underwhelming US labor market reports that put pressure on the Greenback, as previously outlined. The pair received additional support from the UK side, where investors became more confident that the Bank of England (BoE) would hold its rate at 4%—a sharp contrast to the growing expectations for multiple cuts by the US Federal Reserve.
Collectively, these factors propelled the GBPUSD pair to touch 1.3726, its highest level since July 2.
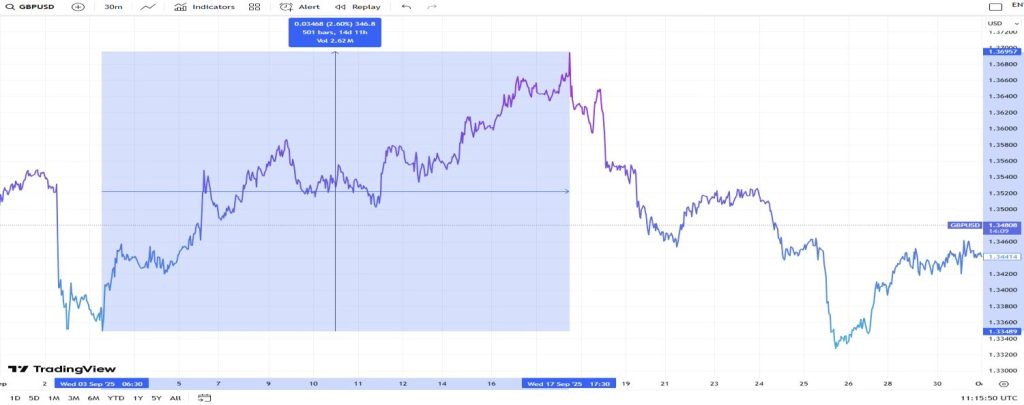
The decisive shift for the pair occurred on September 17, when the Fed’s unexpected “hawkish” rate cut caught markets off guard. The dollar then staged a significant rally the next day as investors adjusted their outlook, pulling back from overly aggressive expectations for further monetary easing.
The dollar continued to gain strength from the series of robust economic data releases toward the end of September, as noted earlier. These developments placed heavy pressure on GBPUSD, which was consequently pushed lower between September 17 and 25.
However, as the month drew to a close, the dollar again came under selling pressure as market concerns mounted over the US administration’s failure to avert a potential government shutdown past the September 30 fiscal deadline. This change in sentiment fueled a late-month rally in GBPUSD, with the pair finishing September trading near 1.34.
Separately, Gold (XAUUSD) had a tremendous run in September, hitting an all-time high of $3,861.265 toward the end of the month.
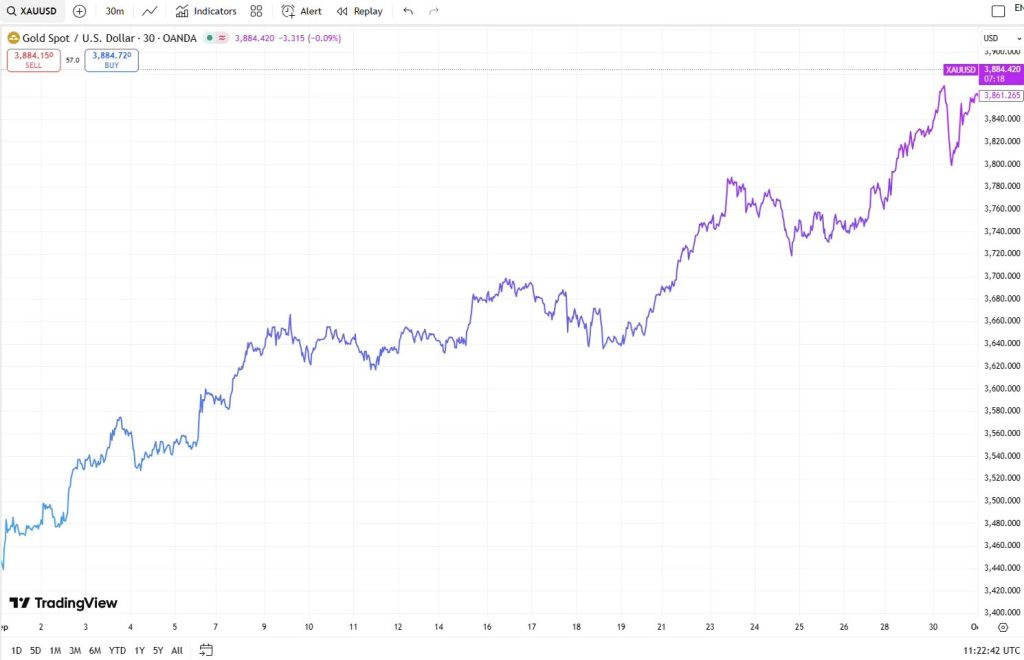
The ongoing rally in Gold this year has been fundamentally supported by four key factors: sustained purchasing by central banks, a trend toward diversification away from the US dollar, resilient demand for the metal as a safe haven amid geopolitical and trade frictions, and general weakness in the dollar.
Gold started the month strong, rising 1% on September 2 to break the then-record high of $3,500 as investors bought the metal on increased certainty of a Federal Reserve rate cut and ongoing political and economic risks. Three days later, the weak US payrolls data (only 22,000 jobs added) solidified the expectation that the Fed would ease, causing the precious metal to surge another 1.4%, nearly reaching $3,600.
The non-yielding asset maintained its upward momentum as traders awaited the Federal Reserve meeting, having fully priced in a 25 basis point cut and even assigning a slight possibility to a 50 basis point reduction. Anticipation surrounding the September 17 Fed meeting pushed gold to new heights; on September 16, gold vaulted past $3,700 per ounce for the first time. The surge was underpinned by a combination of safe-haven demand, central bank buying, and wagers on an imminent Fed cut.
After the Fed delivered its first rate cut of the year on September 17 and suggested the potential for further easing, Gold entered a brief period of high volatility. The following day, September 18, prices slipped to about $3,643.40 as some investors took profits.
However, the metal quickly resumed its upward trajectory, driven by persistent safe-haven demand and elevated geopolitical tensions, particularly those related to the Russia-Ukraine war as NATO adopted a more aggressive stance toward potential Russian aggression. Additionally, strong purchasing interest from ETF investors—fueled by rate-cut expectations, concerns over the Fed’s independence, and geopolitical events—provided an added boost to gold prices.
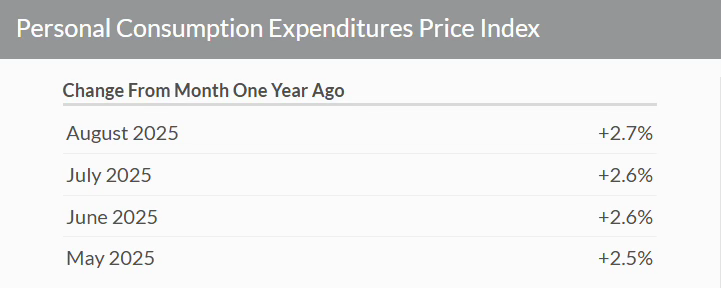
Toward the end of the month, Gold made gains after US inflation data met expectations: over the twelve months through August, PCE inflation increased 2.7%, slightly up from the 2.6% climb in July. This outcome reinforced bets that the Federal Reserve would continue cutting interest rates later this year, thereby supporting the non-yielding asset, which generally performs well in a low-interest-rate environment.
The precious metal attracted additional safe-haven inflows at the very end of September due to escalating concerns that the US administration might be unable to prevent a government shutdown past the September 30 fiscal deadline.
In summary, the price action observed in September underscores the increasing influence of diverging monetary policy trajectories, setting the stage for October to be a decisive month for global markets. Heading into October, with the Fed initiating rate cuts while other major central banks approach the conclusion of their easing cycles, the resulting narrow yield differentials suggest continued USD weakness—and broad rallies across key currency pairs. Concurrently, gold is well-positioned to extend its gains in the coming weeks, bolstered by a tense geopolitical environment, risk-off market sentiment, and consistent purchasing by central banks.
System Breakdown
R-10
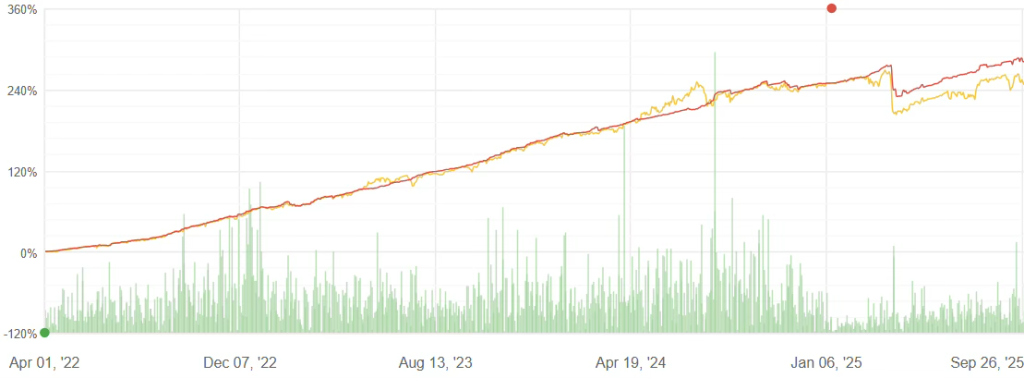
R-50
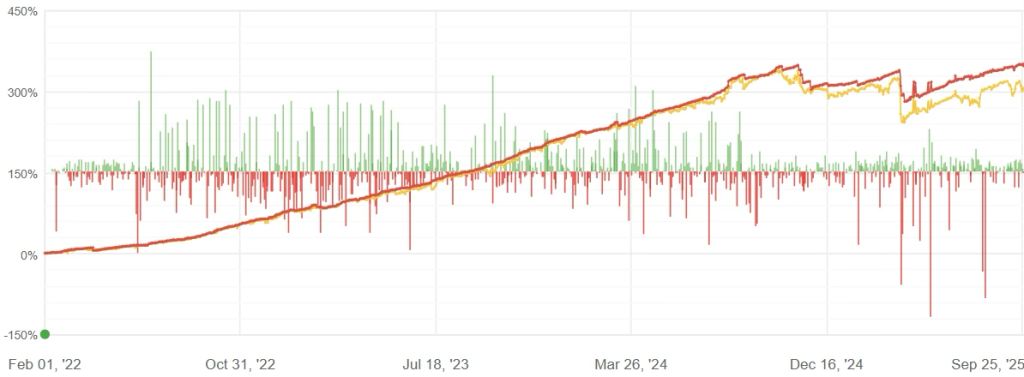
In a highly volatile environment defined by policy uncertainty and outsized directional swings, R-50 and R-10 performed strongly in September, delivering 1.62% and 1.09%, respectively.
Both systems trade the same subsystems, with the R-10 applying a slight filter on smaller trades to accommodate a lower minimum deposit.
For R-50, EURUSD long/short, XAUUSD long/short, and NZDCAD long/short were the biggest profit contributors to its P/L, while the AUDCAD short and NZDUSD long incurred the largest losses.
Gains from EURUSD long and short positions demonstrate the system’s effectiveness in capitalizing on two-way market moves – positioning effectively to benefit from the rally in the first half of September, as the US dollar struggled amid labor market concerns, while also capitalizing on the subsequent downswings as the dollar rebounded following the Fed’s ‘hawkish’ cut and a string of macroeconomic releases showing US economic resilience.
Notably, the system’s ability to generate profits on even the XAUUSD short positions – despite gold’s unprecedented run in September, breaking past several record highs and crossing $3,800 for the first time – underscores its nimbleness in capitalizing on the metal’s brief stretches of decline during the month.
Meanwhile, R-10’s top P/L contributors were also EURUSD, XAUUSD, and NZDCAD.
During the period, R-50 entered 2,808 trades, with a win percentage of 60% and an average holding period of 1 day. Meanwhile, R-10 entered 659 trades, with a win percentage of 61% and an average holding period of 2 days.
All subsystems were thoroughly reviewed and re-calibrated at the end of September to ensure consistency and optimal performance, particularly in light of the prevailing market conditions.
R-X25
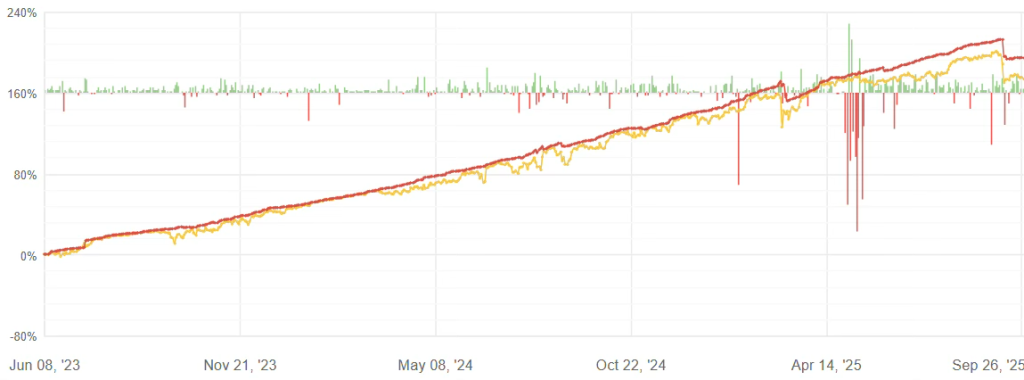
In a month characterized by exceptionally high volatility and severe market swings, R-X25 encountered significant resistance, resulting in a return of −4.59%.
The system executed 1,273 trades, achieving a win percentage of 56% with an average holding period of 1 day.
GBPUSD long/short, XAUUSD long/short, and EURUSD long/short were the largest profit contributors, whereas the most significant losses came from AUDCAD short, NZDCAD short, and AUDNZD short positions.
These losses were primarily caused by highly unexpected and unprecedented price movements in the Australian, Canadian, and New Zealand dollars. Following weeks of relatively contained ranges and moderate trends, these currency pairs broke into outsized directional moves during September, which ultimately wrong-footed our models. Nevertheless, while such extreme market dislocations are uncommon, they are a low-probability characteristic of FX markets. With market conditions stretched and several pairs closing September in technically overbought territory, a return to the mean in the weeks ahead is certainly plausible.
By the close of September, the system’s top three pairs by exposure were EURUSD long, AUDCAD long, and XAUUSD long.
All subsystems underwent a thorough review and re-calibration at the end of September to guarantee consistency and optimal performance, especially considering the current market environment.
R-X5
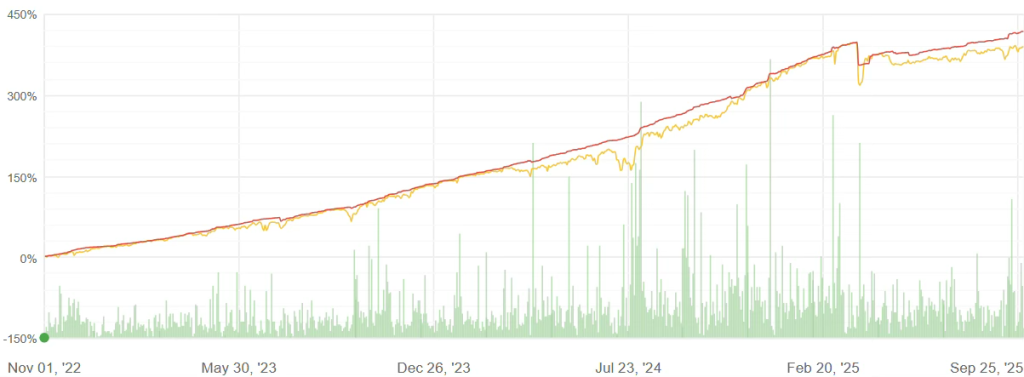
Amid a particularly challenging trading environment dominated by unusually high volatility and directional extremes, R-X5 delivered a robust return of 3.33% in September.
The system executed 723 trades, maintaining a win percentage of 62% and an average holding period of 2 days. Its Profit Factor—the ratio of total gross profit to total gross loss—registered at 1.97, a reflection of the system’s remarkably high efficiency during a period defined by extraordinary market uncertainty.
EURUSD long/short, GBPUSD long/short, and NZDCAD long/short were the primary drivers of profit, while AUDCAD short and USDCAD short were the only positions to notably detract from the performance.
The profits generated from both long and short positions in EURUSD and GBPUSD underscore the system’s ability to effectively capitalize on two-way market movements. It successfully positioned to benefit from the rallies in the first half of September, as the US dollar weakened amid labor market concerns, and subsequently captured gains from the downswings as the dollar rebounded following the Federal Reserve’s ‘hawkish’ interest rate cut and a series of macroeconomic releases pointing to US economic resilience.
The loss incurred on the AUDCAD short position stemmed primarily from an unusual and unprecedented price pattern. After weeks of contained price ranges and moderate trends, the pair experienced outsized directional movements in September, which ultimately wrong-footed the models. While such extreme market dislocations are rare, they are a known low-probability feature of the FX market. Given that market conditions are now stretched and the pair closed September in overbought territory, a mean reversion in the coming weeks would not be an unexpected development.
By the end of September, the system’s top three pairs in terms of exposure were EURUSD long, AUDCAD short, and NZDCAD long.
All subsystems underwent a thorough review and re-calibration at the end of September to ensure consistency and optimal performance, especially in light of the prevailing market conditions.
R-C30
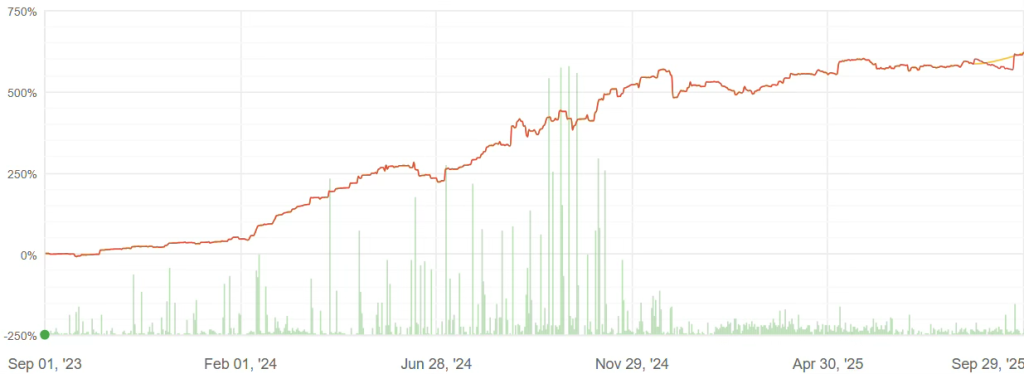
The R-C30 trading system, maintaining a balanced exposure to both BTCUSD and ETHUSD, successfully navigated a volatile and uncertain macro environment in September to deliver a 4.87% monthly gain.
Trading Metrics: The system demonstrated strong execution efficiency, completing 284 trades with a high 71% win rate and an average holding period of approximately 14 hours. Its Profit Factor, calculated as the ratio of total gross profits to total gross losses, was 1.62, underscoring the system’s robust performance even during a period of market instability.
Performance Drivers:
- ETHUSD short positions were the primary source of monthly profit. Ethereum’s price trajectory saw a sharp mid-month rally followed by a sustained downturn, ultimately closing September with a net decline of approximately −6.75%. The R-C30 system effectively capitalized on this bearish trend for significant gains.
- The largest losses were incurred on BTCUSD short trades. Bitcoin’s price exhibited an uncharacteristic strength for September, which is historically a weak month for the asset. BTCUSD finished the month up approximately 4.50%, after reaching an intra-month peak advance of 8.94%.
End-of-Month Positioning: By the end of September, the R-C30 system’s total exposure was significantly concentrated in ETHUSD, which accounted for nearly 59% of the overall position size.