
Overview
After a relatively calm period of trading throughout the summer, the beginning of September is showing signs of increasing equity volatility in most of our systems. This is largely expected, as markets tend to pick up in directional volatility after a summer trough. The previous weeks had been marked by ranging markets and medium strength trends with frequent retracements. This balanced market environment allowed the diversified approach of our systems to extract a solid risk-adjusted return from the markets.
Starting last week however, we have seen extraordinary strong directional moves across a couple of pairs, resulting in above average exposures and floating drawdowns across most of our systems. With this market report, we aim to bring you clarity on these points:
- 1. What is happening and why
- 2. How are our systems affected
- 3. FAQ
1. What is happening and why
In early September we have witnessed a sharp change in market behaviour, most visibly in the foreign exchange space. After several weeks of relatively orderly ranges and medium-strength trends, markets have broken out into extraordinarily strong directional moves.
A prime example is the Australian dollar against the Canadian dollar (AUD/CAD), which has surged higher with strong momentum. The rally has unfolded almost without retracements, creating one of the strongest short-term trends we have seen in recent quarters. See the graph below, showing a parabolical increase on AUDCAD over the last daily bars.
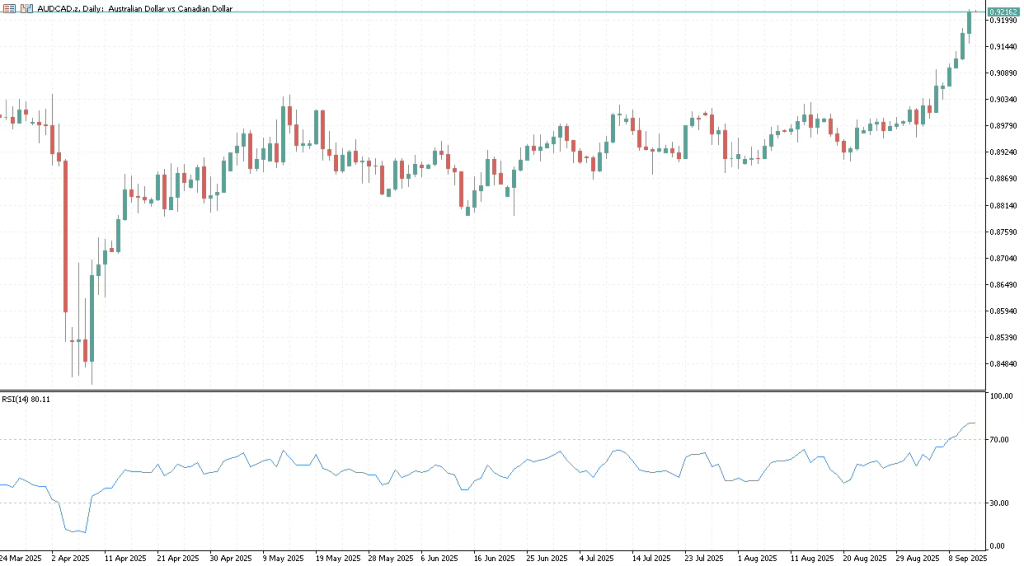
While the move is carried on strong momentum, it has reached overextended levels. As shown in the graph above, the RSI indicator (14-day, daily) is showing a reading above 80, signaling very overbought conditions. While this alone is no indication for an upcoming decline, it does increase the projected volatility of a reversal or retracement on this move. The Canadian dollar came under indirect pressure by the weak footing of its close relative the USD. At the same time, the AUD was carried to heights on three main factors: risk sentiment, metal prices, and the speculations of rate cuts from the Bank of Canada.
In our opinion, each one of these factors is fragile:
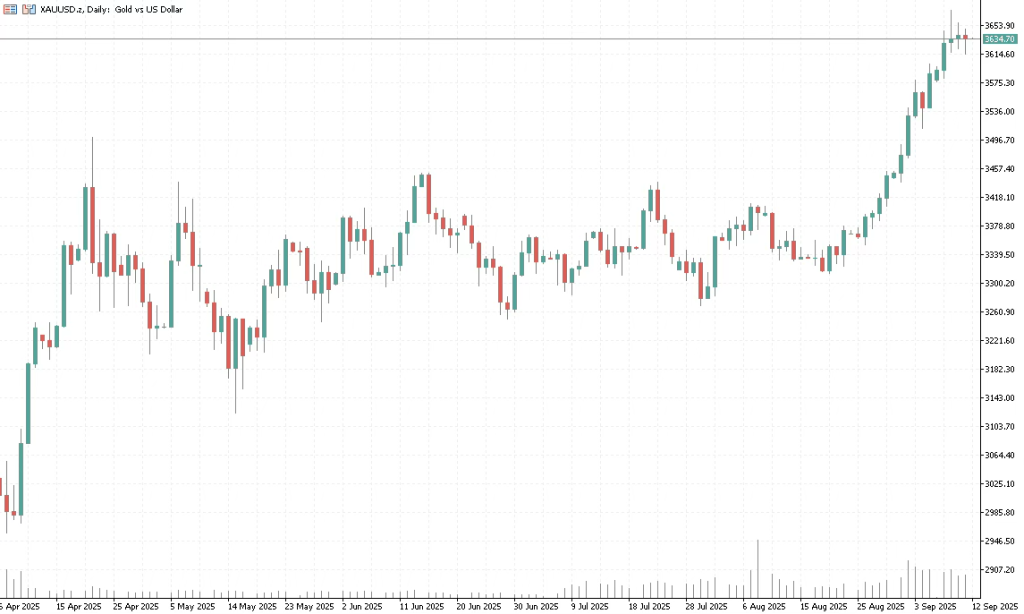
Firstly, the Australian dollar is a high-beta, risk-sensitive currency. In times of strong risk appetite, AUD tends to outperform. However, if equity markets remain volatile into September and October historically choppier months global investors may rotate back into safer currencies, to the detriment of AUD. The Canadian dollar, while not a pure safe haven, is less exposed to risk-on/risk-off swings than AUD. Secondly, Canada’s currency is strongly correlated with oil prices, while Australia’s is more tied to metals and minerals. Gold had a major run-up in the first week of September, but is also overstretching, opening the opportunity for a setback / consolidation on the metal. If energy markets tighten the Canadian dollar could strengthen materially. At the same time, weaker Chinese demand or softer global growth could drag down metal prices, reducing Australia’s terms of trade advantage.
Look at the chart below of Gold over a recent period, AUDCAD closely tracked the gold moves in recent days and is likely to weaken as Gold loses momentum.
Finally, while yes, markets speculate on BoC cuts, the Reserve Bank of Australia has already resumed cutting rates. The market may well have over-interpreted the medium-term yield advantage for AUD. In reality, the more dovish RBA trajectory means that Australia is entering a looser policy phase, which normally weighs on its currency. By contrast, the Bank of Canada (BoC) is holding policy steady at 2.75%. If Canadian inflation proves stickier than expected, the BoC could maintain this rate for longer, reinforcing relative support for CAD.
All in all, we see the move nearing its short to medium-term peak and expect the emergence of a topping structure in the following days, consolidating gains and retracing parts of the explosive move. This pattern has repeated over and over historically, and in fact proves a main alpha source for multiple of our subsystems.
2. How are our systems affected?
Our R-series systems are built in a modular way, where each system is created from a wide array of subsystems, each trading differently and providing natural hedging. This is done to reduce overall exposure, by matching negatively correlated approach with each other and thereby increasing risk-adjusted returns. Distributing the capital across this multitude of subsystem greatly decreases the exposure to any one trading style, effectively handling tail-risk. If any one subsystem fails and triggers it´s subsystem level risk-cutoff, the impact on the entire system is relatively small. In most cases between 1% and 3%.
With a strong directional trend move as we see it now, mainly mean reversion strategies across our subsystem base get stuck in unrealized drawdown. Currently, there are multiple subsystems trading AUDCAD. With a handful of them actually getting caught on the wrong side of this move. The current floating drawdown consists of the trades from multiple different entry/exit strategies, that usually run very uncorrelated. However, during a major market move they can become clustered. We manage this by keeping exposure to any asset limited and enforcing our 3 level risk management module, which cuts or hedges the subsystems individually, taking into account the entire system status.
This approach allows us to scale into positions with different logic and also exit at different points. It is very likely that these subsystems exit the trade at different times and if negative, with very controlled losses not a major crash. This is by design and has proven to be successful in the past.
The main portion of open drawdown is caused by: AUDCAD short, NZDCAD short, and for older accounts, remaining hedged trades from April, although that these are near stationary.
3. FAQ
Is this abnormal / has this happened before?
While the move is extraordinary in its scale vs previous market environment, it is not a blackswan or similar. The current move is strong, but still within the usual volatility bands of the market.
Yes, this has happened many times before. As mentioned in the market update section, these strong trends followed by reversals are actually the backbone of several subsystems as they yield great profit during ranging periods, which occupy a large portion of market regimes.
Will the system take losses?
Yes, our entire methodology is built to counter tail-risk. Letting exposure run unchecked is the very thing we are trying to combat with our R-series systems. They are designed to either take controlled losses, or hedge smartly, neutralizing parts or all of the exposure and recovering.
We prefer taking small, controlled losses, vs putting the entire account on the line. We take risk management seriously. This is real trading, taking losses is part of the process, most important is the alignment with vision, methodology and the trust in the long-term process.
Are our systems martingale strategies?
No, while some of our subsystems do use averaging techniques for trade entries, our systems are no martingale systems. Even if some trade series look like it, trades do not necessarily belong to the same subsystem. There are multiple subsystems trading any pair at any given time and sequences often actually come from multiple subsystem in sequence by chance.
All of our subsystems are limited to their risk allocation and will be closed out or hedged once their trading reaches the subsystem SL.
How have similar situations played out previously?
Although we don’t have a crystal ball to forecast the exact outcome of this situation, we can allude to previous situations and their outcomes.
We have track records with live trading data since early 2022, since then several occasions such as now have occurred. Our systems are designed to withstand these and have been proven to do so over and over. Taking subsystem stop-losses is not extraordinary and can, in most cases, be recovered within 2-3 weeks – if trades are hedged, they remain near neutral until a clear market direction emerges and exposure can slowly be reduced.