
Overview
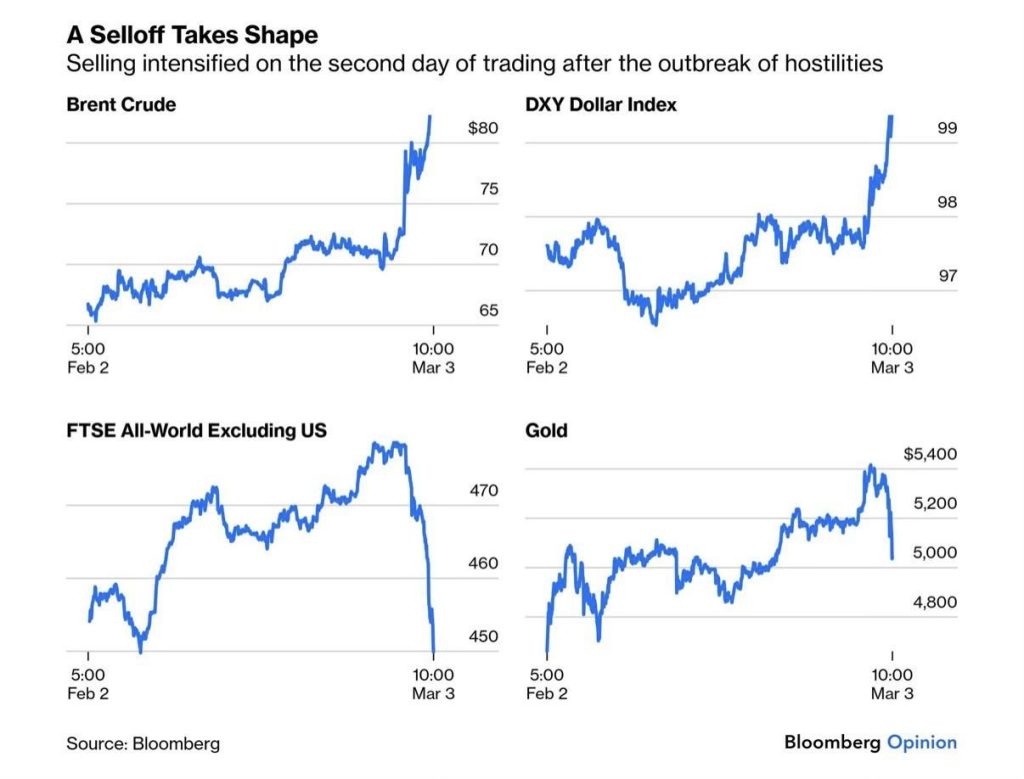
The month of March 2026 stood as a pivotal moment when geopolitical tensions resurged with an intensity that caught global financial markets completely off guard. Following the military actions taken by the United States and Israel against Iran in late February, the subsequent blockage of the Strait of Hormuz by Iranian forces crippled a primary global oil route and triggered a massive disruption across all investment sectors. This sudden escalation forced a total reevaluation of traditional risk-management strategies, as the immediate rise in fuel costs and renewed inflationary pressure eliminated any chance of interest rate reductions by the Federal Reserve. Consequently, investors were forced to confront a stagnant economic environment characterized by high energy prices and restricted monetary policy, which led to significant and widespread volatility throughout the international foreign exchange markets.
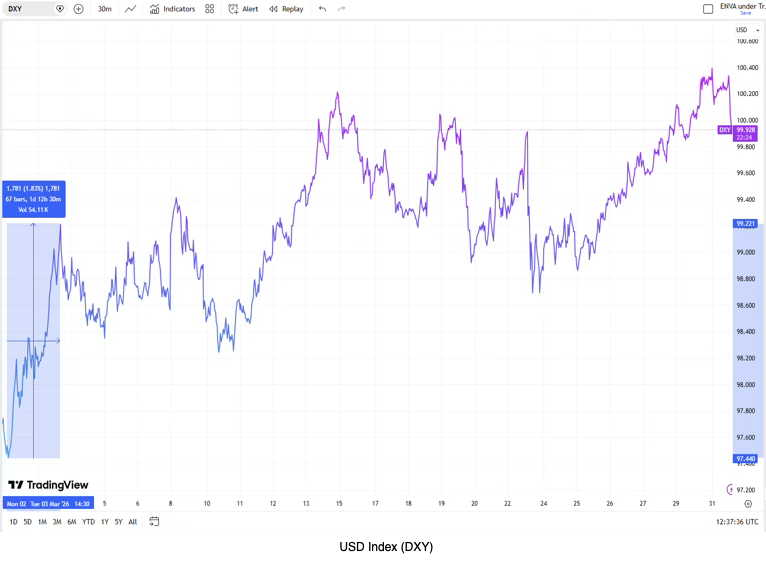
The American currency occupied the absolute heart of the chaos. A series of political crises, stagnant economic reports, and sudden shifts in diplomacy occurred in rapid order, driving the dollar index through five specific periods defined by aggressive gains and sudden, massive retreats.
The initial move occurred between 2–3 March and left no room for doubt. Military operations by the US and Israel against Iran during the prior weekend caused the Revolutionary Guard to shut down the Strait of Hormuz – a vital passage for nearly 20% of the world’s petroleum – triggering a sudden and comprehensive rush toward secure assets. Oil costs jumped, fears regarding inflation grew stronger, and financial markets rapidly adjusted their forecasts for Federal Reserve policy by delaying the first anticipated rate reduction until July. Because the desire for safety and the fear of rising prices were aligned, the greenback climbed by almost 2% over those two days, reaching a peak of 99.22 on March 3.
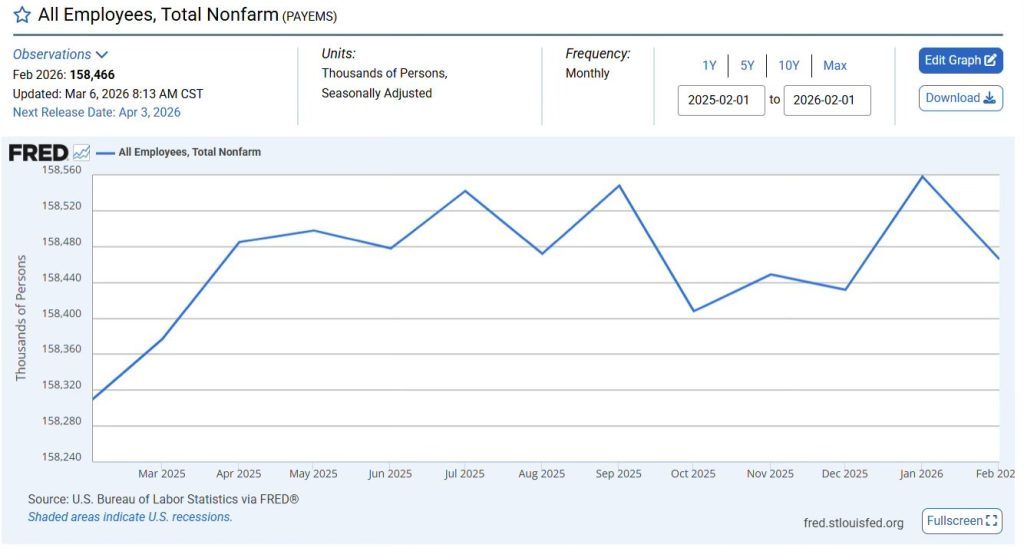
Yet the period spanning 4–12 March witnessed remarkable instability lacking any clear trend, as the dollar index swung aggressively around the 99.00 level in response to a constant stream of conflicting data. The employment sector provided the most confusing signals: while private hiring figures from ADP exceeded predictions at 63,000 compared to an expected 50,000 and the service industry index hit a forty-two-month peak of 56.1 against a projected 53.5, the formal government labor report presented a contrasting narrative – the market actually lost 92,000 positions in February despite hopes for a 50,000 increase, driving the jobless rate up to 4.4%.
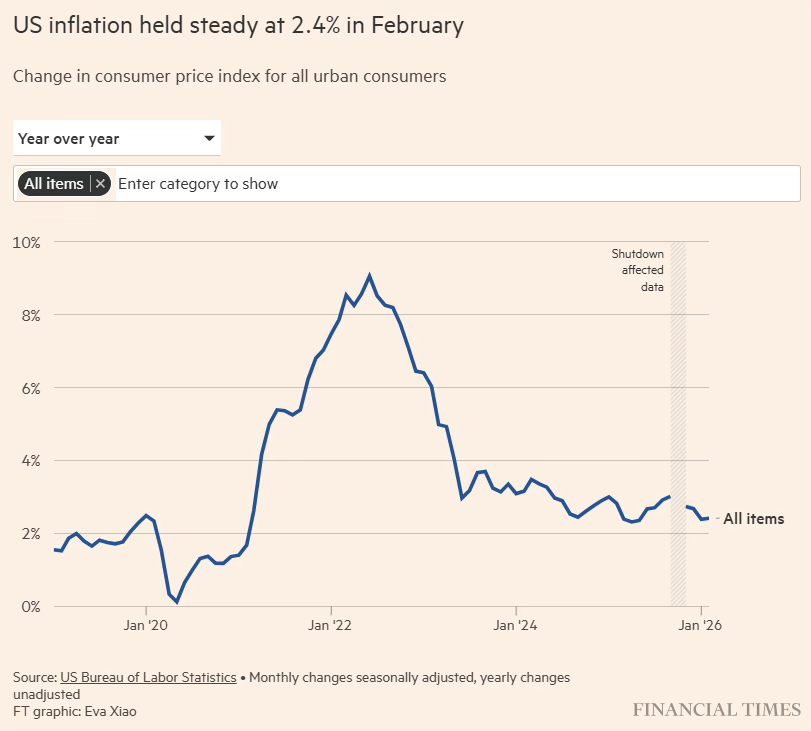
The inflation data for February, published on 11 March, met expectations exactly across the board with the main rate at 2.4% annually and the underlying core at 2.5% failing to provide the spark needed to end the market deadlock. On the political front, the updates were just as muddled, as the executive branch hinted at a coming resolution while defense officials characterized the current strikes as the most aggressive phase of the operation. The greenback moved sideways, unable to establish a clear direction or find stable support.
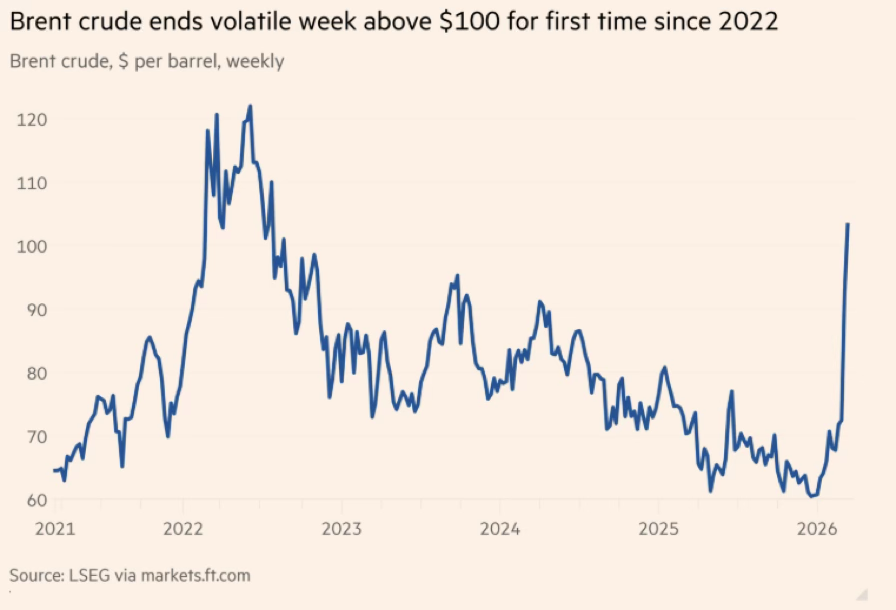
The period of indecision ended during 12–13 March. This shift was fueled by energy developments rather than economic statistics: the latest Iranian leadership indicated that the blockade of the Strait of Hormuz might serve as a permanent strategic tool, and as global oil prices neared $100 a barrel, investors began to view the disruption as a long-term driver of inflation instead of a temporary threat.
Forecasts for interest rate reductions, which had already been scaled back, dropped even lower, and the greenback reacted by climbing past the critical 100.00 benchmark on March 13 for the first time since the previous November.
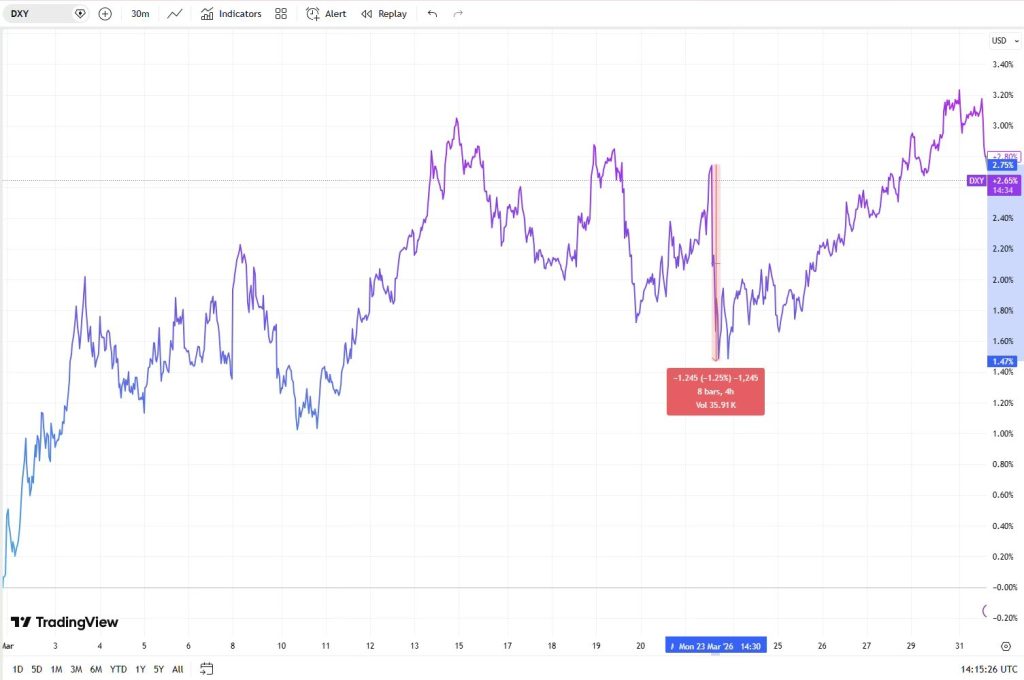
The timeframe between 15 and 23 March represented the most intense phase of the entire month. The dollar index entered this interval having hit a ten-month peak of 100.54 on 13 March, subsequently softening as market fear decreased due to rumors that the Iranian hostitilies might conclude in the near future. This decline was suddenly halted by the FOMC meeting on 18 March; while the Federal Reserve kept rates at 3.50–3.75% as anticipated, the revised economic outlook was unexpectedly aggressive, raising the 2026 inflation forecast to 2.7% and showing that seven officials now expected no rate drops this year. The greenback jumped to daily highs before reversing those gains the next day, falling under 100.00 to near 99.40 as other global central banks hinted at their own tightening, which lessened the impact of the Fed’s stance. The month’s most turbulent trading day then occurred on 23 March, triggered by Trump’s announcement that intended attacks on Iranian oil facilities would be delayed following successful diplomatic talks with Tehran.
Petroleum prices plummeted by over 9%, the demand for defensive assets vanished within a few hours, and the dollar index fluctuated by more than 125 points, falling from a daily peak close to 100.15 to finish the trading session at approximately 99.12.
From 24 March until the close of the month, the American currency underwent a rapid and powerful rebound. Tehran’s direct refutation of any active discussions instantly dismantled the previous move toward de-escalation, and as military movements persisted alongside Iran’s dismissal of an American peace proposal, investors rushed back into the dollar for protection. The greenback climbed for three straight days, supported by preliminary economic data that suggested the Federal Reserve would maintain its current rates – service sector output dipped and hiring declined for the first time in a year, yet production expenses rose at their quickest rate in ten months, sustaining fears of inflation. A short-lived decline occurred after Trump declared a ten-day suspension of attacks on Iranian fuel systems, but the market saw little selling pressure; Tehran claimed no such deal was sought, the Strait of Hormuz stayed blocked, and the dollar ended March valued near the 100.00 mark.
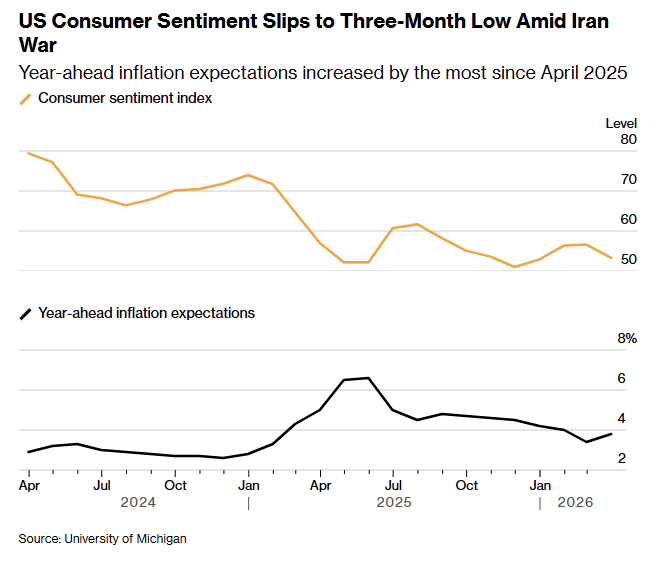
Moving forward, global political tensions will continue to be the primary factor influencing the greenback’s value for the duration of the hostilities. An extended period of warfare ensures that fuel costs stay high and projected inflation continues to climb. The concluding March data from the University of Michigan has already indicated that one-year inflation forecasts jumped to 3.8% from the previous month’s 3.4%, which makes the argument for lowering interest rates much harder to sustain and raises the possibility of further increases if conditions worsen. For the US currency, this environment provides a clearly positive foundation for continued strength.
Amidst an environment defined by the strong greenback, high energy costs, and conflicting economic signals of stagnation and inflation, specific currency matchups developed their own unique narratives. While every pair was impacted by the same global political upheaval, the resulting price action was filtered through the particular economic strengths and vulnerabilities of each individual nation.
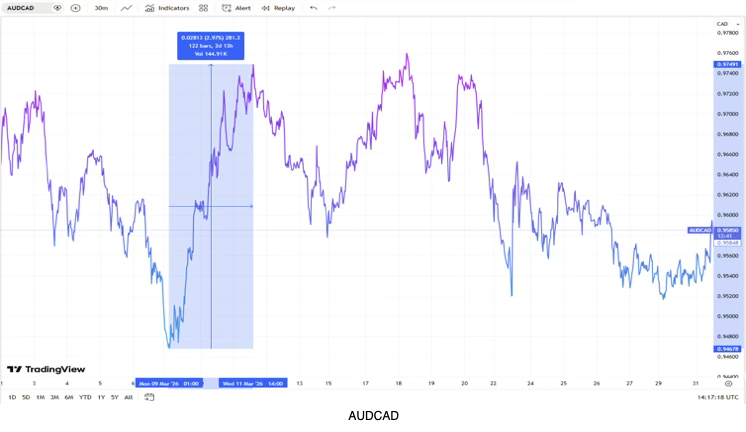
The AUDCAD exchange rate moved through March with several intense, politically motivated turnarounds, as the conflict in Iran and its differing effects on two resource-rich nations dictated the market trend. The pair started with a short-lived climb during the first two days of the month when the initial alarm over the Strait of Hormuz shutdown impacted global sentiment. This advance did not last. As the cost of crude oil accelerated toward $100 per barrel, the economic advantage swung clearly toward Canada as a primary exporter of petroleum, Canada was positioned to profit from high energy costs, leading to a stronger Canadian dollar that pushed AUDCAD through a consistent drop between 3 and 9 March.
The exchange rate rebounded aggressively between 9–11 March prior to falling back once more – this volatility mirrored the uncertainty of investors trying to determine if the surge in oil prices served as a significant advantage for the Canadian export sector or an inflationary burden on growth that would eventually weaken both national currencies.
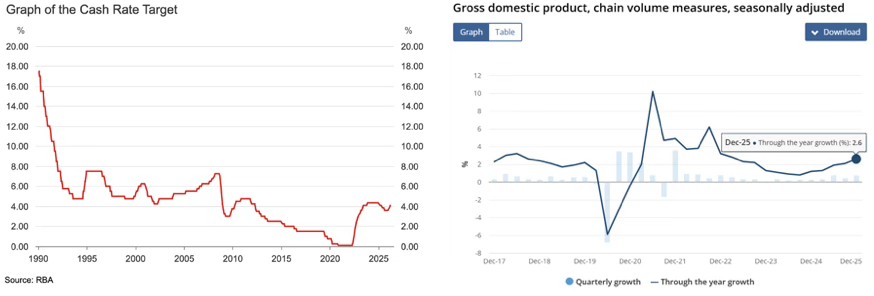
The month’s most significant local driver occurred on 17 March, as the Reserve Bank of Australia opted for a 25-basis-point increase to its benchmark rate, bringing it to 4.10% via a close 5-4 vote. This back-to-back hike was justified by a 2.6% annual growth rate in the last quarter of 2025, a robust 4.1% jobless rate, and consumer price inflation reaching 3.8%. Such a firm stance from the RBA offered substantial support to the Australian currency, allowing the AUDCAD pair to build upon its gains throughout the sessions on 18 March.
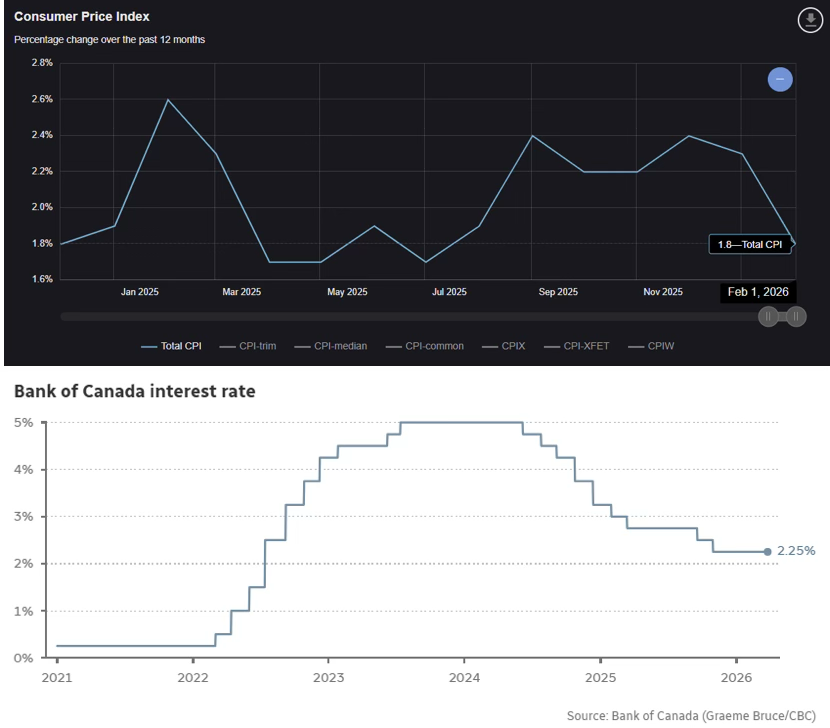
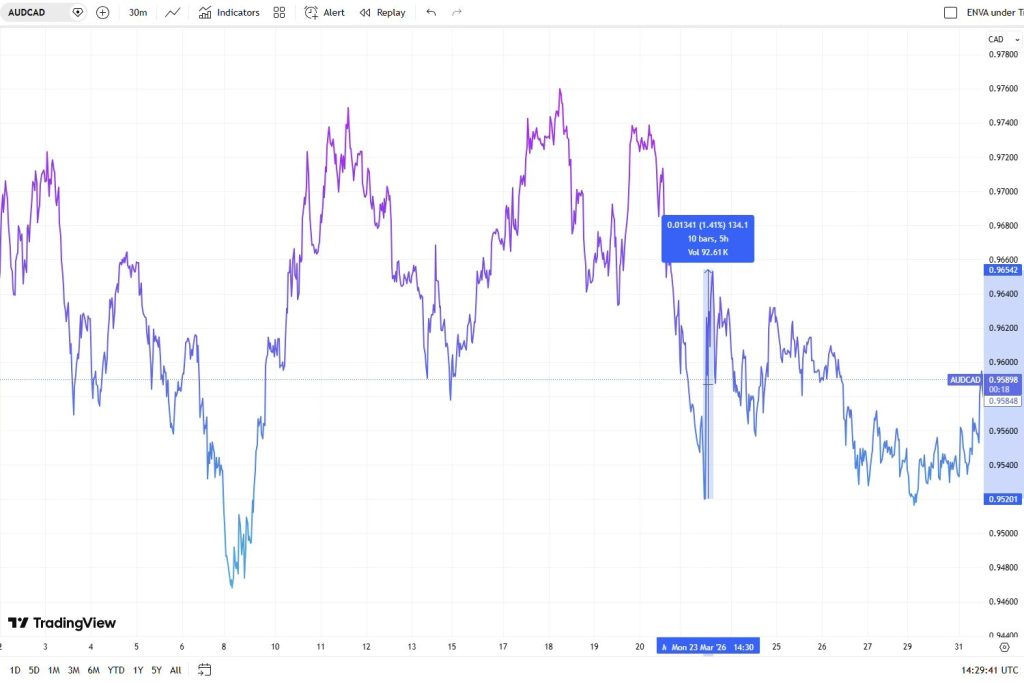
The Bank of Canada maintained its key interest rate at 2.25% during its 18 March session, noting that the national output shrank by 0.6% in the final quarter of 2025 while the labor market lost 84,000 positions in February and inflation cooled to 1.8%. This represented a far more fragile internal economic climate compared to that of Australia. Nevertheless, the central bank’s specific alert that persistent energy costs would likely drive prices upward provided a floor for the Canadian currency, leading to a significant downturn in the AUDCAD exchange rate from 18 to 23 March as the influence of oil prices outweighed a weakening Australian dollar.
The most violent single session for the pair arrived on 23 March, when Trump’s announced pause on strikes against Iranian energy infrastructure sent crude oil collapsing more than 9%. With the Canadian dollar’s oil premium evaporating in hours, AUDCAD surged sharply on the day.
The bounce back ended quickly as Tehran’s rejection of any ongoing talks brought the political risk factor back to the forefront, causing oil costs to rise and the currency pair to continue its downward move through the end of the month. Ultimately, AUDCAD finished March significantly lower than the levels reached during the brief rally following the RBA’s aggressive policy shift. This outcome highlighted that throughout March 2026, global political instability carried more weight in the markets than the differing strategies of individual central banks.
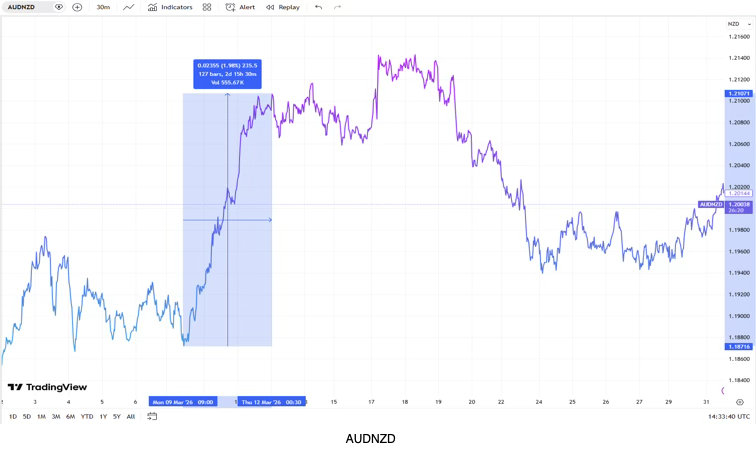
The AUDNZD exchange rate moved through March reacting to the vastly different ways the Iranian conflict affected the two neighboring Pacific nations, finishing the month with a gain of about 1.5%. This upward movement was sustained by a growing gap in economic expansion and monetary strategies between the two countries, which ultimately had a more lasting influence on the pair than the temporary market swings caused by global political instability.
The exchange rate began with a rapid climb between 1–3 March as the sudden energy crisis impacted each nation in contrasting ways. Australia, being a primary provider of coal and liquified natural gas, was positioned to profit from the spike in energy costs, whereas New Zealand – which relies on energy imports – encountered what financial experts at Westpac characterized as a damaging blow to its income and trade balance that would be felt more intensely than in Australia. With petroleum prices climbing toward the $100 mark, the currency pair shifted decisively toward the Australian dollar.
The advance lost steam between 3 and 9 March as investors came to terms with a more complex situation: despite its high export income, Australia still relied heavily on importing processed fuel. This fundamental weakness cooled the initial excitement for the Australian dollar. The pair then took a sharp turn between 9 and 12 March as the surge in oil prices regained momentum, followed by a minor dip when Trump’s remarks implied the hostilities might soon conclude.
The most consequential stretch ran from 13–19 March. The RBA hiked 25 basis points to 4.10% on 17 March while the RBNZ held its OCR at 2.25% in February, an easing cycle that had delivered 325 basis points of cuts since August 2024.
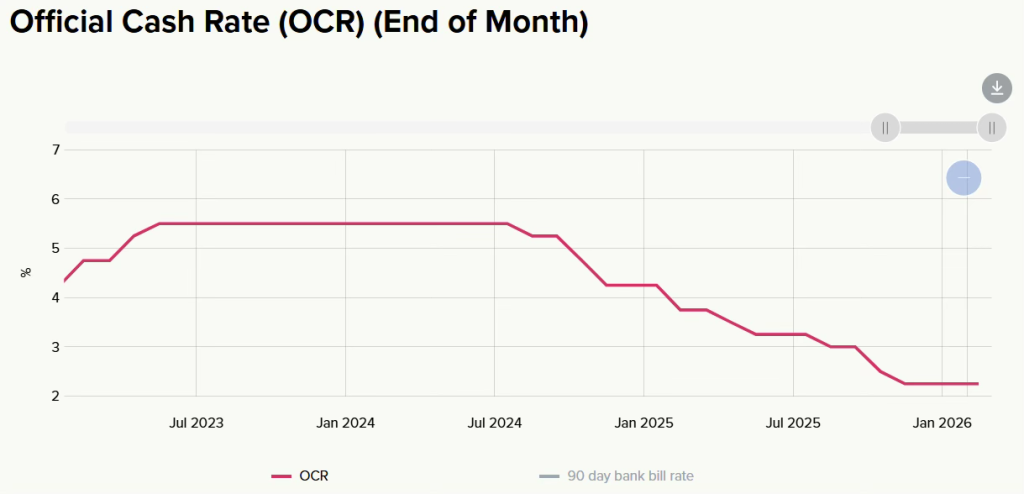
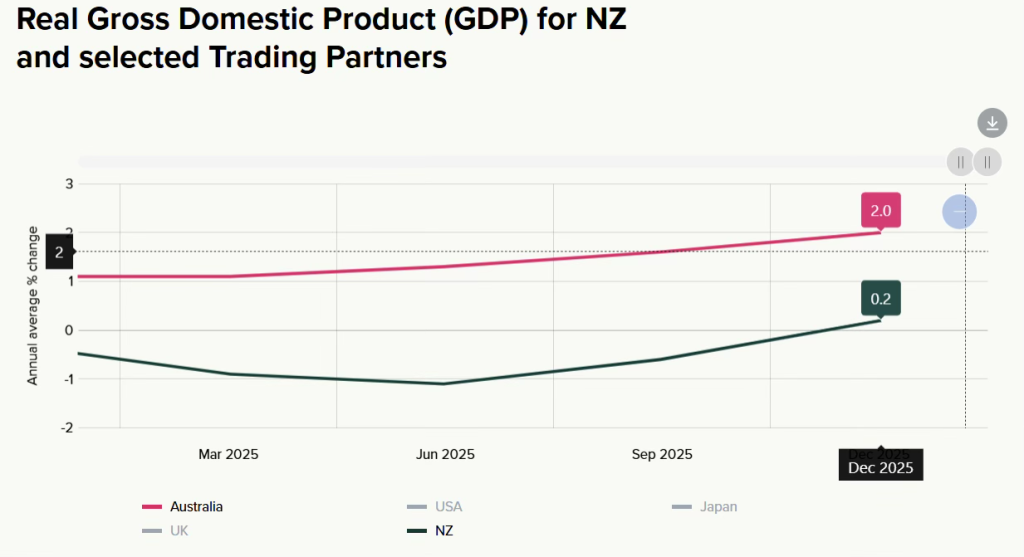
With the interest rate gap now a substantial 185 basis points in favor of Australia, AUDNZD climbed toward its highest levels of the month. New Zealand’s fourth-quarter GDP data, made public on 19 March, highlighted the widening performance gap between the two neighbors: the economy grew by a mere 0.2% for the quarter – dwarfed by Australia’s 2.0% expansion – and fell short of the 0.4% predicted by analysts. The report also pointed to underlying weakness, with the construction sector shrinking by 1.4% and spending by households pulling back.
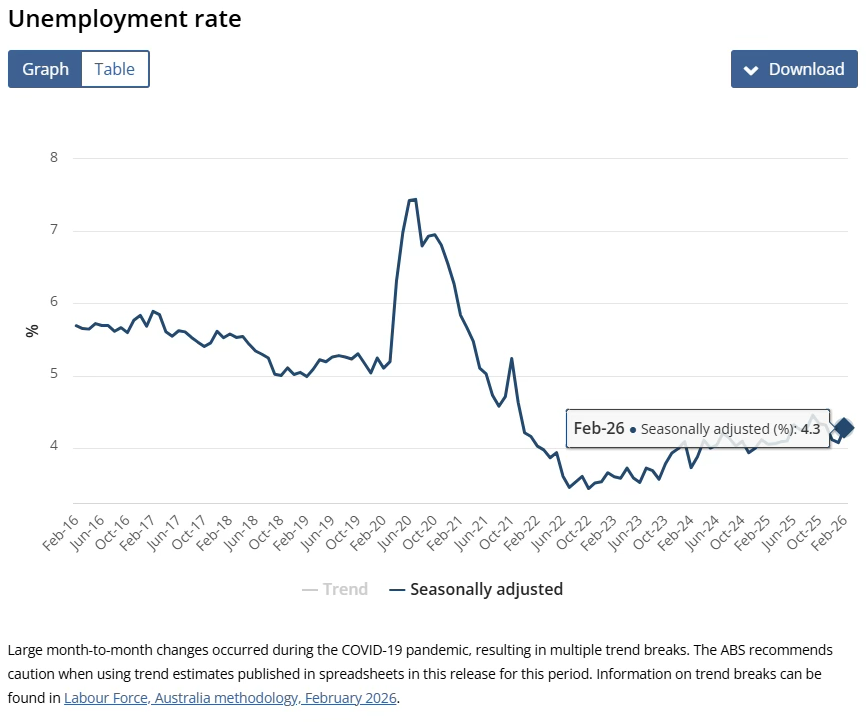
Following the monthly peak reached on 18 March, the exchange rate pulled back sharply as Australia’s labor statistics for February – released on 19 March – revealed a surprise jump in the unemployment rate to 4.3%, missing the 4.1% expectation. Although total employment rose, the data highlighted a shift in the quality of jobs: full-time positions dropped by 30,500, while the overall increase was driven entirely by a surge in part-time roles.
Financial markets immediately adjusted, lowering the likelihood of a May interest rate increase from the RBA from 61% to 57%, which dampened the premium on the rate gap that had been driving the Australian dollar’s strength. This downward move accelerated on 23 March when Trump’s announcement regarding delayed strikes on Iranian fuel sites caused oil prices to crash by over 9%, erasing the advantage held by commodity exporters in a matter of hours. Although Tehran’s quick dismissal of any peace talks helped oil prices recover, the currency pair only made modest gains as the month concluded. While the underlying gap in growth and policy remained, any further rise was limited by a global political climate far too volatile for investors to commit to a clear direction.
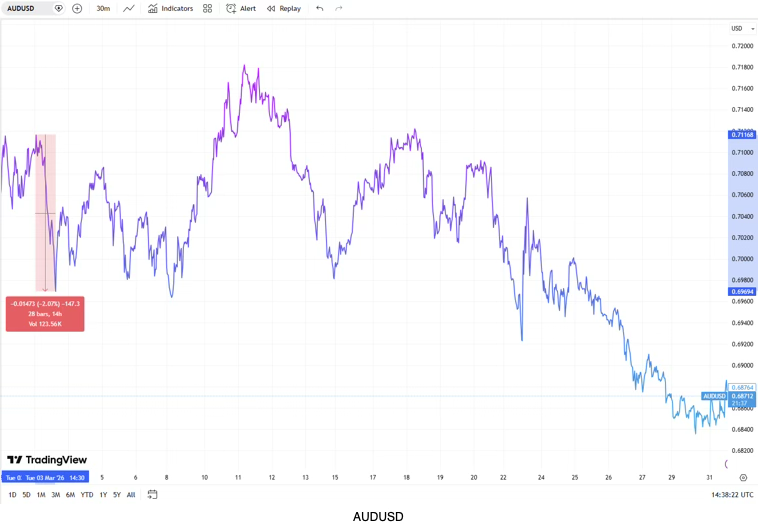
The AUDUSD pair began March trading near the 0.7100 level, supported by a hawkish Reserve Bank of Australia (RBA) and a growing interest rate advantage over the US Federal Reserve. However, it quickly encountered the most challenging macroeconomic conditions in months, finishing the month roughly 1.81% lower at approximately 0.692. This decline was fueled by a combination of safe-haven demand for the US dollar, stagnant US economic data paired with high inflation, and a cooling of the Australian economy that weakened the argument for higher rates.
The first major setback occurred on 3 March, as the sudden “risk-off” sentiment triggered by the war in Iran hit the pair unexpectedly. As a currency highly sensitive to global risk appetite, the Australian dollar bore the brunt of the move into the US dollar. It plunged more than 2.0% in a single trading session, driven by fears of a global energy crisis following the closure of the Strait of Hormuz.
The exchange rate then entered a period of unstable consolidation from 3 to 8 March as two opposing forces neutralized each other. While persistent risk aversion linked to the Iran conflict kept the Australian dollar under pressure, the US dollar’s gains were limited by a disastrous February labor report. US nonfarm payrolls fell by 92,000, starkly missing the expected 50,000 gain, which clouded the American growth outlook and checked the greenback’s momentum.
This sideways movement gave way to a vigorous recovery between 9 and 11 March. The catalyst was a series of comments from Donald Trump suggesting that the military objectives were nearly met and the conflict could be “finished pretty quickly.” These remarks eased the intense “risk-off” sentiment and allowed the prior weak employment data to finally weigh on the US dollar, propelling the AUDUSD pair back toward the 0.7180 level.
The recovery was brief. Beginning on 11 March, reports that Iran’s leadership intended to keep the Strait of Hormuz closed indefinitely caused a major shift in market sentiment. Investors began viewing the energy crisis as a long-term fixture rather than a temporary spike.
As Brent crude neared $100 per barrel, expectations for any interest rate cuts vanished, fueling a surge in the US dollar. This downward pressure on the pair accelerated on 13 March following a cluster of contradictory US economic data:
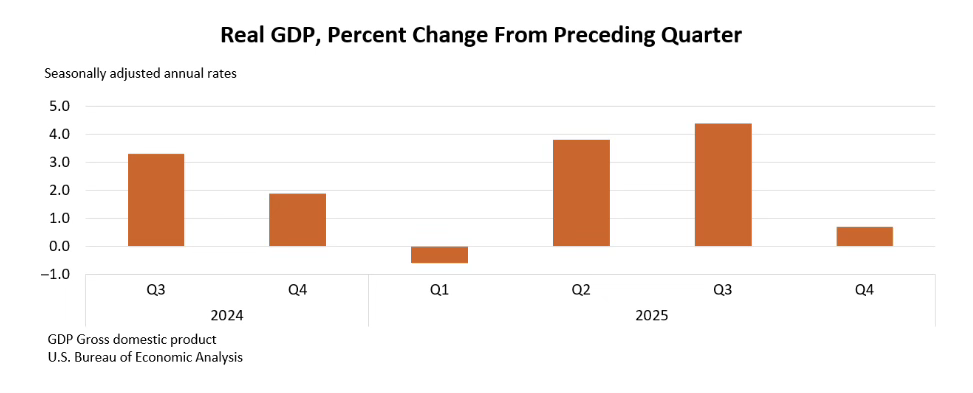
- Q4 GDP: Revised significantly downward to a mere 0.7% annualized growth.
- January Core PCE: Came in high at 3.1% year-on-year.
- Durable Goods Orders: Remained stagnant at 0.0%, missing the 1.3% forecast.
These figures painted a picture of “stagflation” – stagnant growth paired with high inflation – which effectively killed any hopes for Federal Reserve rate cuts and intensified the Australian dollar’s slide.
The downward trend took a momentary break as investors adjusted their positions in anticipation of the Reserve Bank of Australia’s policy meeting. The 17 March announcement – a 25-basis-point hike bringing the cash rate to 4.10% – sparked a vigorous recovery between 15 and 18 March. With Australian rates now sitting 35 basis points higher than the Federal Reserve’s 3.50–3.75% target range, the pair found some fundamental footing.
However, this relief did not last. On 19 March, Australia’s February labor report revealed a climb in the unemployment rate to 4.3%, missing the 4.1% estimate. This cooling of the labor market lowered the probability of a subsequent hike in May and set off the most persistent sell-off of the month.
The exchange rate declined steadily, breaking through the 0.6950 mark. This fall was only briefly disrupted on 23 March by a sudden surge in risk-taking after Donald Trump announced a delay in strikes on Iranian energy sites; however, the rally collapsed within hours once Tehran denied that any negotiations were actually taking place.
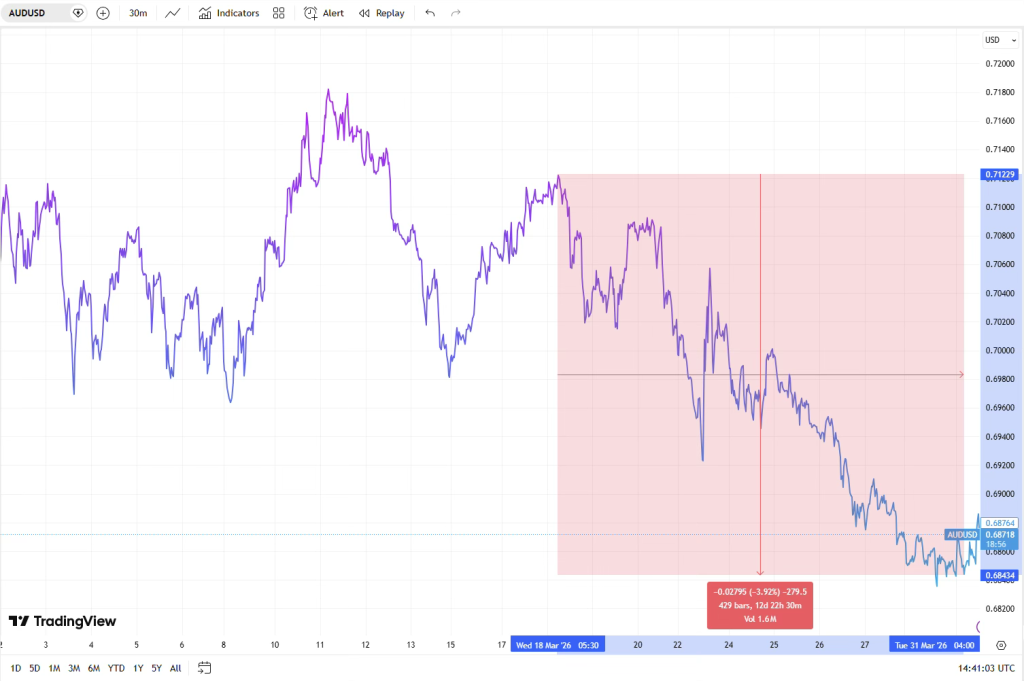
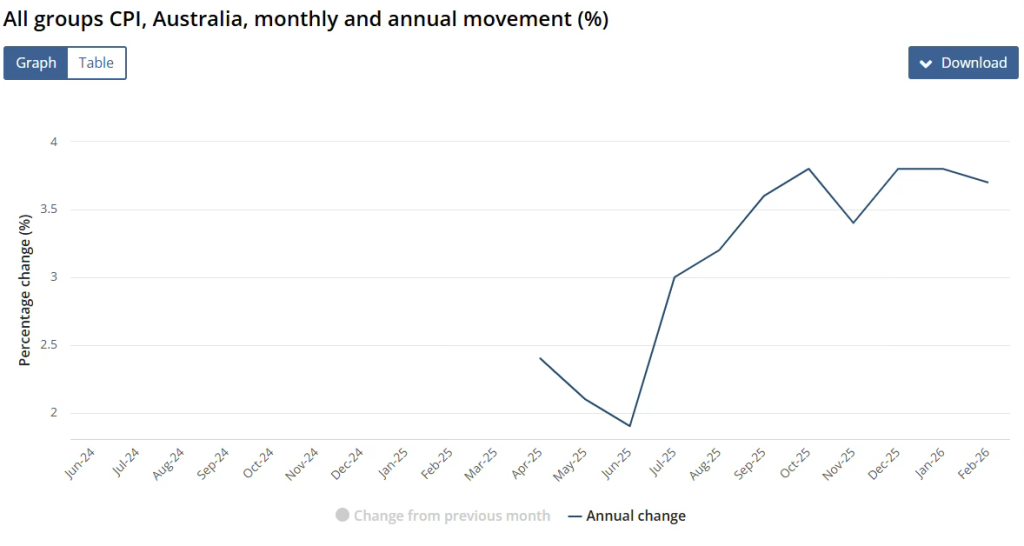
The final trigger arrived on 26 March, when Australia’s monthly CPI indicator for February showed no growth (0.0% month-on-month). This result caused the annual inflation rate to dip slightly to 3.7% from the previous 3.8%.
This unexpectedly soft reading further weakened the case for a Reserve Bank of Australia interest rate hike in May. As market expectations for continued tightening faded, the Australian dollar’s decline accelerated, pushing the AUD/USD pair lower as the month came to a close.
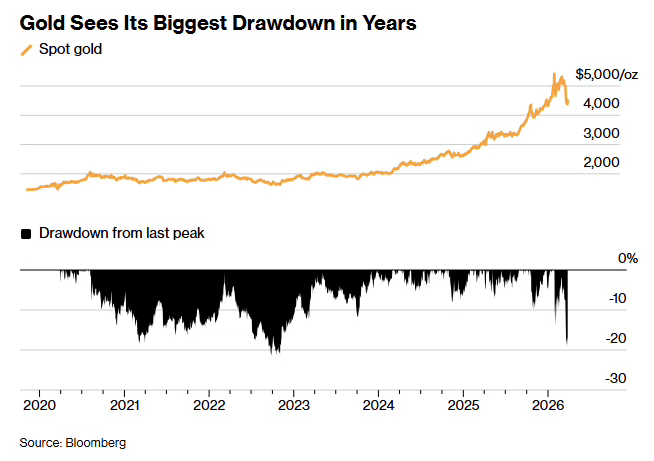
The performance of gold throughout March 2026 completely defied standard expectations for a protective asset. Even with one of the most significant global political crises in recent memory unfolding, the commodity finished the period down by nearly 11%. This decline occurred because the US dollar’s aggressive rise as a preferred safety net acted as a much more dominant market driver than the historical tendency of gold to gain value during times of international turmoil.
The period began with a momentary spark of standard defensive buying. Gold prices jumped from approximately $5,296 to $5,423 right after the Iranian attacks, yet this upward momentum collapsed nearly as fast as it appeared. By 3 March, the commodity had lost over 6% of its value, dropping to roughly $5,085 as investors realized a difficult truth: the spike in inflation caused by rising oil costs was boosting the greenback and removing any expectations for Federal Reserve rate reductions two major obstacles for a non-interest-bearing asset valued in US currency.
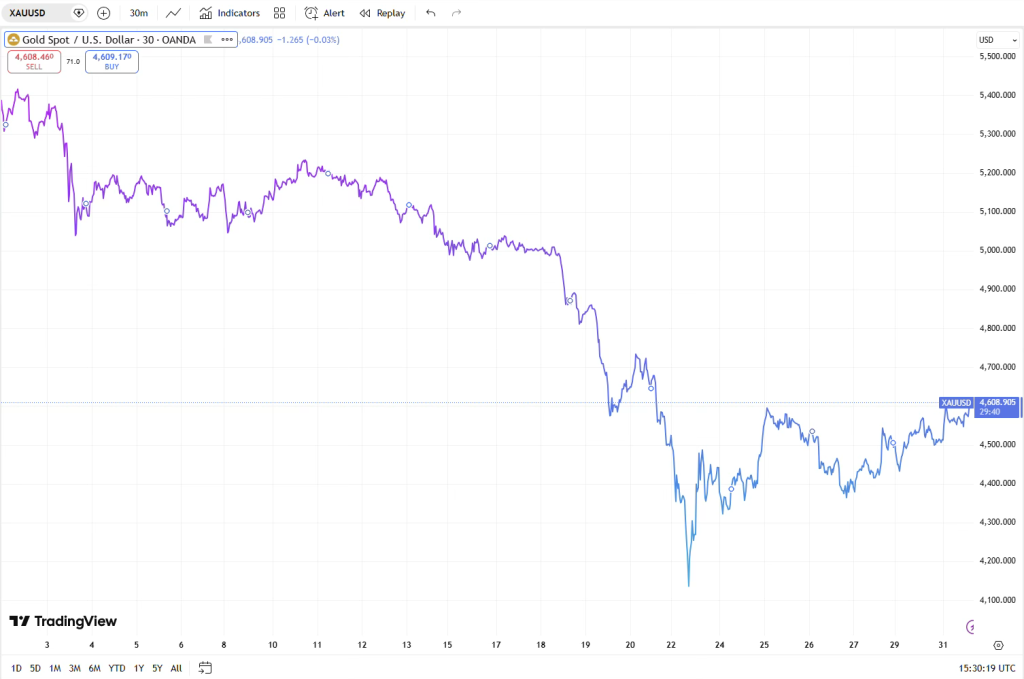
The sideways movement between 3 and 18 March hid a persistent decline in the asset’s core fundamental outlook. A minor recovery on 9 and 10 March, sparked by Donald Trump’s hints at cooling tensions, vanished rapidly, and gold slipped under the critical $5,000 threshold to $4,986 by 16 March as the greenback continued its steady climb.
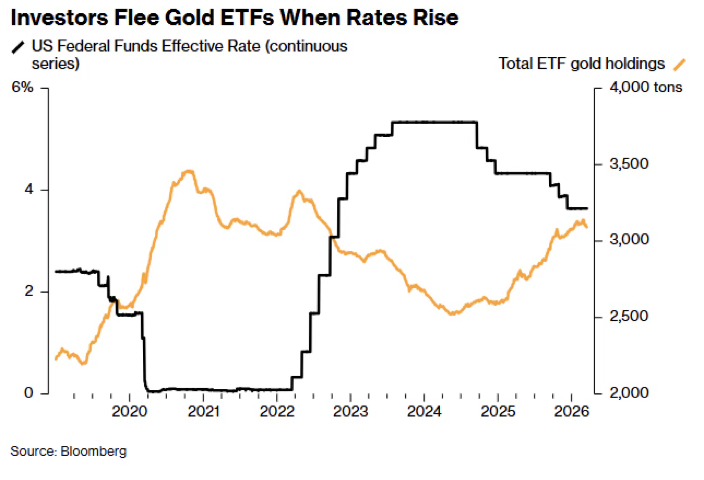
The major collapse occurred on 18 March. February’s producer price data came in at 0.7% month-on-month more than twice the 0.3% market forecast and the Federal Reserve’s decision to keep rates steady while maintaining a firm stance that same afternoon proved fatal: the revised “dot plot” indicated only a single rate reduction for all of 2026, propelling the US dollar toward the 99.9 mark. Gold plummeted 3.7% in a single session, sparking a sell-off that exceeded mere interest rate adjustments. As the prospect of prolonged high rates made interest-bearing investments far more appealing, monthly ETF withdrawals hit their highest levels since 2022 and hedge funds reduced their holdings to the lowest point since October, while margin calls in other sectors compelled investors to sell off gold holdings regardless of price.
The Wall Street Journal characterized the move as the most significant one-week dollar drop for the metal since 1975. Starting at $4,860 on 18 March, gold plummeted to a low of nearly $4,100 by 23 March before bargain hunters began to step in, eventually bringing the price to roughly $4,720 as the month closed a figure nearly $700 lower than its starting point in March.