
Geopolitical Currents Drive Volatility
While May’s foreign exchange markets were largely shaped by U.S. economic headlines, June proved to be a different story. An exceptionally dynamic geopolitical landscape, primarily fueled by the Iran-Israel-U.S. conflict, sent conflicting signals across the markets throughout the month.
The month kicked off with whispers of a potential nuclear accord between Iran and the U.S. However, these discussions quickly unraveled following Israeli strikes against Iran, met with forceful retaliatory actions from both sides. The situation escalated dramatically when the U.S. intervened, targeting Iranian nuclear facilities. A sense of relief washed over markets when President Donald Trump subsequently announced an unexpected ceasefire between Iran and Israel.
Amidst these dramatic twists and turns, markets reacted with heightened sensitivity, frequently shifting between risk-on and risk-off sentiment.
The U.S. Dollar’s June Struggles
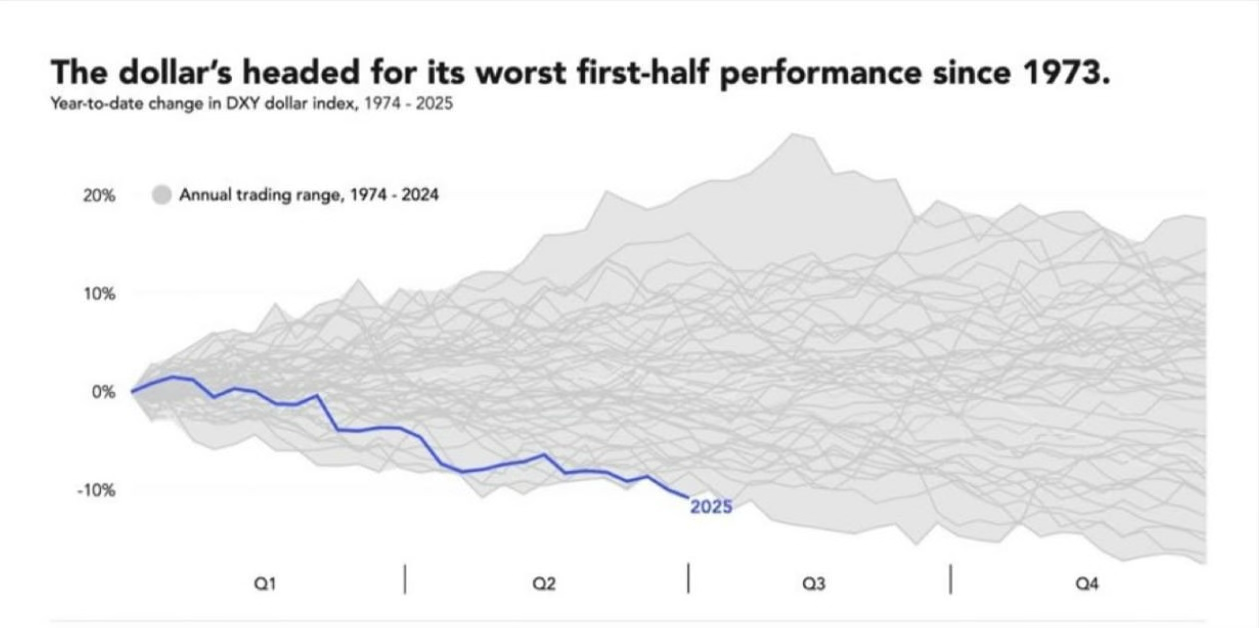
The U.S. Dollar Index (DXY), which measures the dollar against a basket of six major currencies, saw a subdued performance in June. Several factors converged to create headwinds for the greenback:
- Political Interference: President Trump’s public criticism of Fed Chair Jerome Powell regarding the timing of interest rate cuts injected significant uncertainty into the markets.
- Dovish Fed Stance: The Federal Reserve leaned increasingly dovish in response to growing signs of an economic slowdown.
- Inflationary Concerns: Worries grew over the potential inflationary impact of U.S. fiscal policy and Trump’s tariff agenda.
- Capital Outflows: These risks prompted investors to move capital into other safe-haven currencies.
The DXY experienced two significant shifts during June:
It saw a notable decline on June 11th after softer-than-expected May inflation figures increased expectations for a 25-basis point Fed rate cut in September. By the close of June 12th, the index had fallen approximately 1.55%, dipping below 98.00 for the first time since April 2022. Investor skepticism about the longevity of a modest U.S.-China trade deal and Trump’s threats of unilateral tariffs further pressured the dollar. This led to a significant dollar sell-off in favor of safe-haven currencies like the Japanese Yen (JPY) and Swiss Franc (CHF) over that two-day period.
However, the dollar’s downward trajectory was eventually halted after the Fed opted to keep its policy rate unchanged at 4.25%-4.50% at its June meeting. Jerome Powell indicated that the full impact of Trump’s tariffs required more time to assess, justifying a “wait-and-see” approach. The dollar also found support from increased safe-haven demand as Middle East tensions intensified.
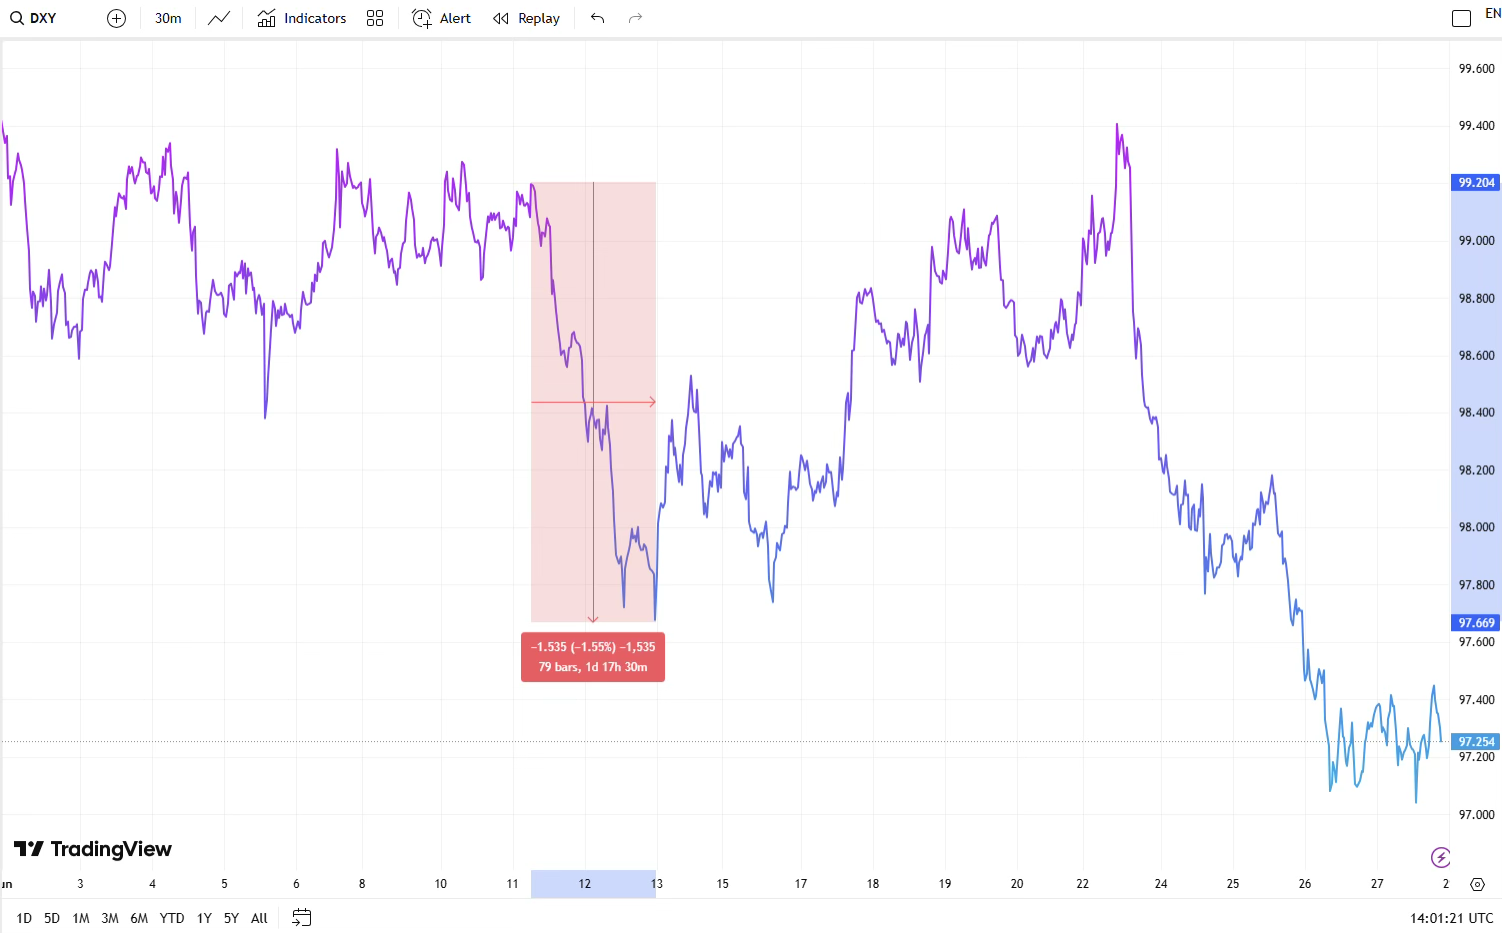
As the DXY chart illustrates, the dollar strengthened through mid-June. Yet, following a sharp spike over the preceding weekend—when the U.S. carried out strikes on key Iranian uranium sites—the dollar saw a sharp decline on June 23rd. The announcement of a ceasefire between Iran and Israel swiftly reduced safe-haven demand for the dollar, as markets embraced optimism despite initial skepticism about the truce’s durability.
Furthermore, President Trump’s suggestion of replacing Jerome Powell as early as October, especially after Powell tempered expectations for a July rate cut due to tariff-induced inflation concerns, compounded the dollar’s woes. Growing apprehension about the Fed’s independence led to heavy selling pressure on the dollar in late June, pushing the DXY near 97.00, its lowest level in three years.
Looking ahead, the combination of mounting pressure from Trump for rate cuts and emerging signs of U.S. economic fatigue could prompt the Federal Reserve to adopt a more dovish policy stance, even if inflation remains slightly above its 2% target. This scenario poses a potential headwind for the U.S. dollar.
Disappointing U.S. Economic Data
U.S. economic data released throughout June was generally disheartening:
- Q1 GDP growth came in at -0.5%, worse than the initial estimate of -0.2%.
- Personal income fell by 0.4% in May, significantly below the expected 0.3% increase and a stark reversal from April’s 0.7% gain.
- Personal spending also dropped by 0.1%, missing the consensus forecast for a 0.1% increase and down from the previous month’s 0.2%.
- Most notably, the U.S. Consumer Price Index (CPI) rose 2.4% year-over-year in May, below market expectations of a 2.5% increase. The core CPI, excluding volatile food and energy prices, rose 2.8% YoY in May, compared to the consensus of 2.9%.
Amidst this flood of disappointing figures, markets are now anticipating a 50-basis point rate cut by the Fed by year-end. According to the CME FedWatch Tool, the probability of a 25-basis point rate cut in September has increased to 72%.
Currency Pair Performance
Throughout June, the shifts in the U.S. dollar served as the primary driver for movements across major currency pairs.
EUR/USD: A Strong Rally
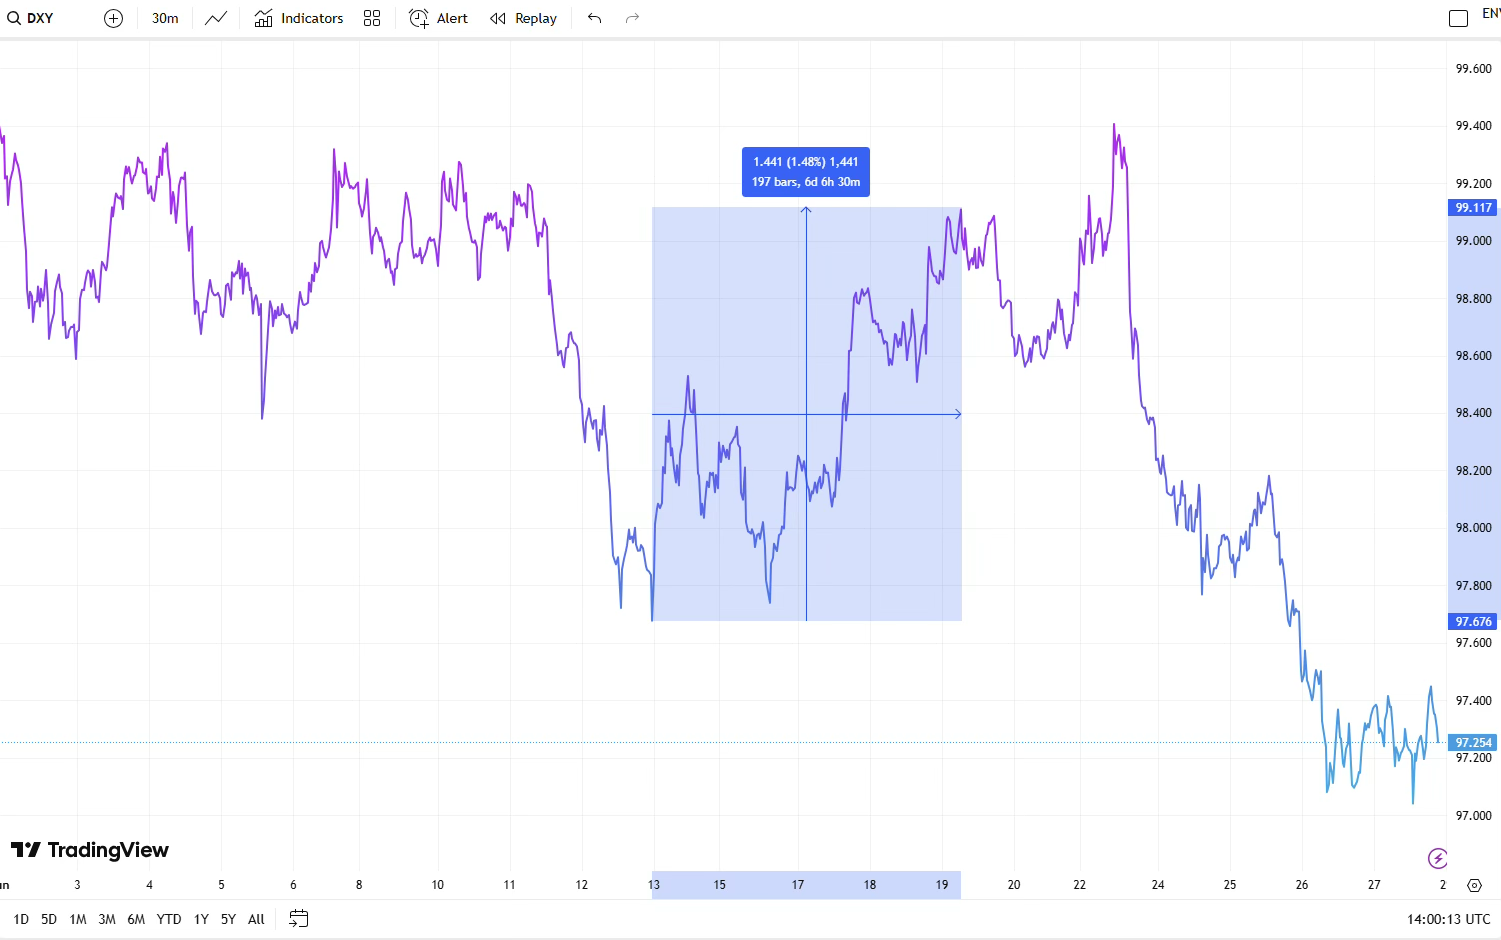
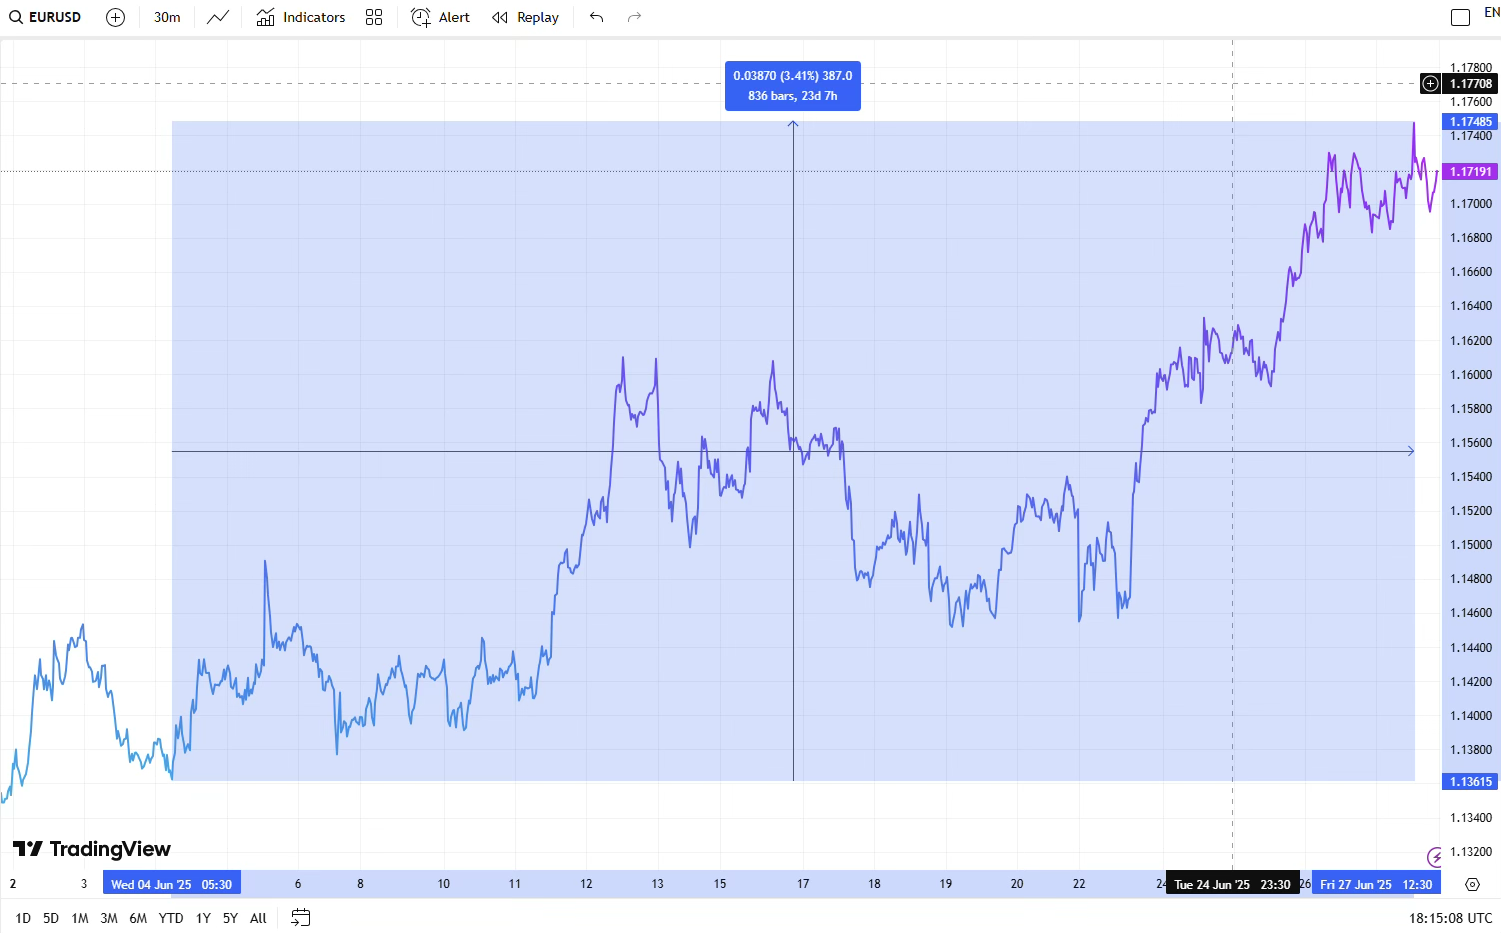
The EUR/USD pair staged a strong rally over the month, with notable upward surges around June 11th and June 23rd—both key breakout points for the greenback. Trump’s continued push for rate cuts, easing geopolitical tensions later in the month, and a series of weaker-than-expected U.S. economic data fueled expectations of Fed easing, putting downward pressure on the dollar and propelling the EUR/USD rally.
While the European macroeconomic front was relatively quiet, the Euro found support after the ECB signaled its rate-cutting cycle might be nearing completion. Swap markets are now pricing in only one 25-basis point cut from the ECB over the next 12 months, in contrast to the two 25-basis point cuts expected from the Federal Reserve by year-end. This divergence in policy outlook provided a tailwind for the Euro. Against this backdrop, the EUR/USD pair reached its highest level since September 2021 at 1.1754 on June 27th.
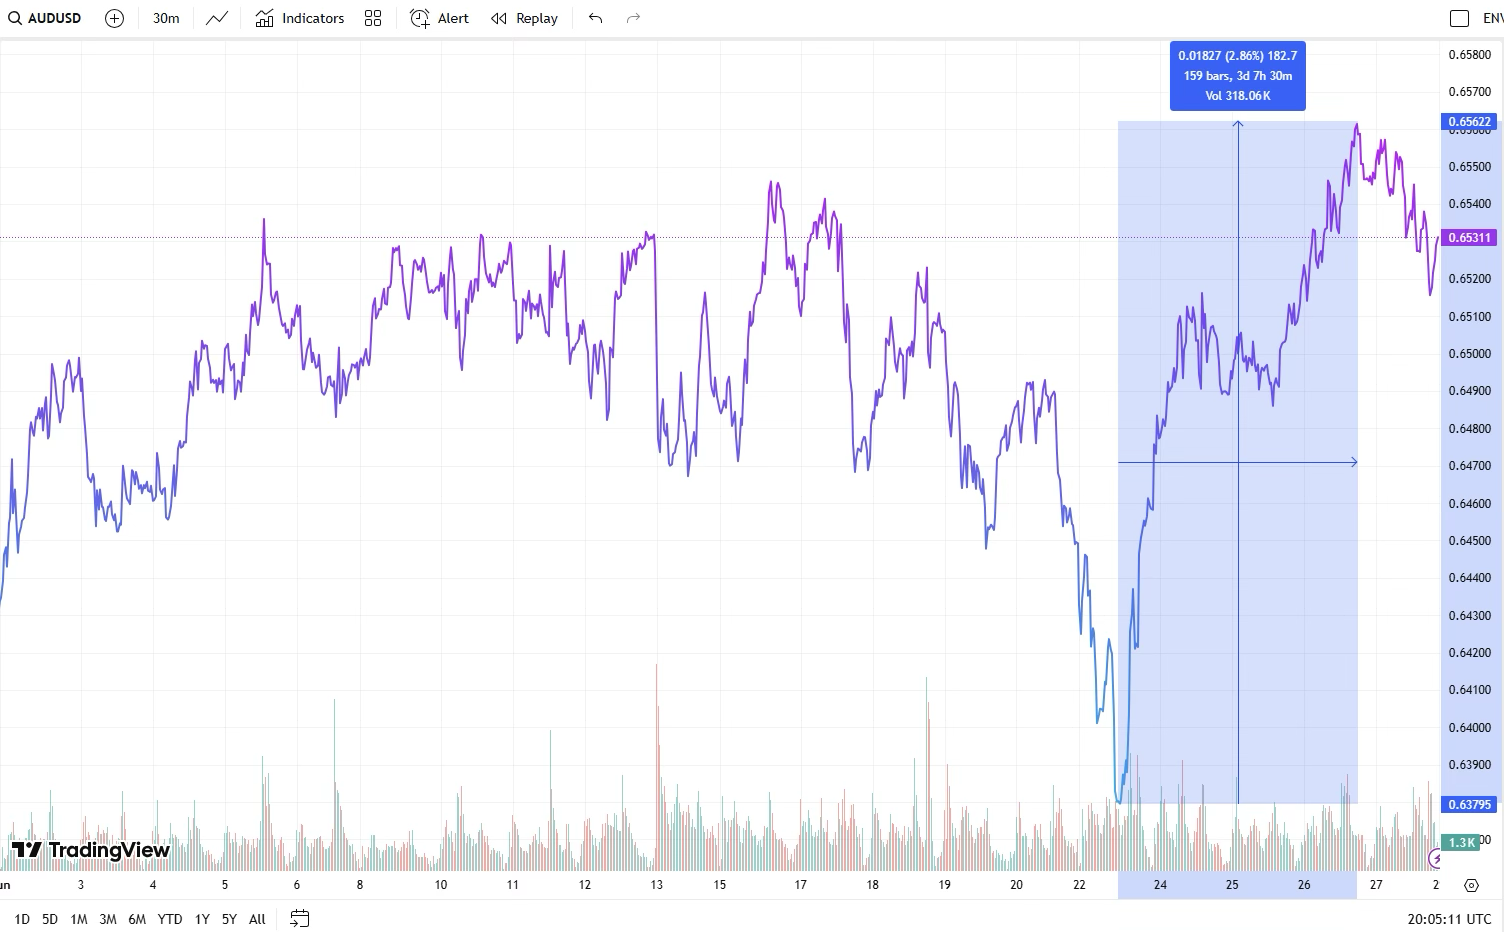
AUD/USD: Mirroring Euro’s Moves
Interestingly, the AUD/USD price action closely mirrored that of the EUR/USD, with both pairs primarily influenced by U.S. dollar movements. The pair initially declined sharply around mid-May as escalating geopolitical tensions boosted demand for the U.S. dollar as a safe-haven asset. However, the Iran-Israel ceasefire in the final week of June triggered a strong rebound, as improving risk sentiment reduced safe-haven flows and weighed on the dollar. The pair was further supported by a broad USD sell-off following President Trump’s public criticism of Fed Chair Jerome Powell, which injected uncertainty into the outlook for U.S. rate cuts.
Notably, toward the end of the month, the Australian dollar touched a fresh year-to-date high of 0.6564 before pulling back slightly. At the time of this writing, the pair remains elevated, hovering around 0.6531.
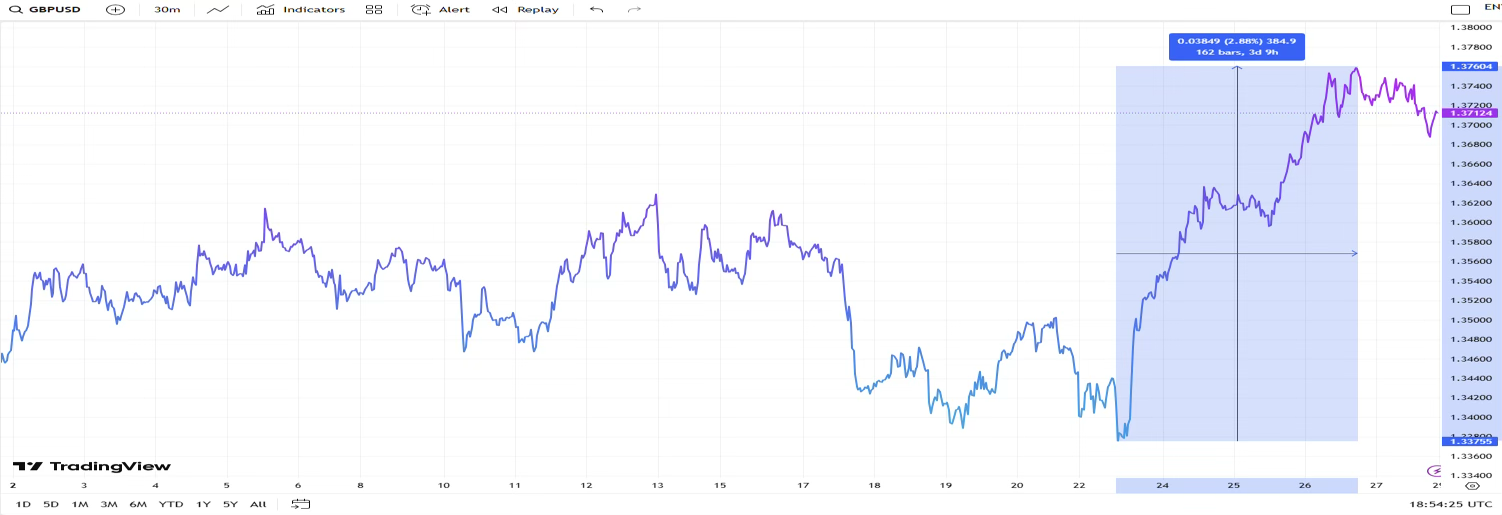
GBP/USD: Choppy Start, Strong Finish
The GBP/USD pair saw choppy movements during the first two weeks of June. The pair plummeted around mid-June as Middle East tensions intensified, leading markets to pivot into the U.S. dollar for its safe-haven appeal. However, the Pound Sterling rallied sharply against the U.S. dollar following the Iran-Israel ceasefire announcement. Markets swiftly shifted to a risk-on sentiment, reducing demand for the safe-haven greenback. The pair also benefited from the U.S. dollar’s broad sell-off as uncertainty over Fed leadership clouded the timing of rate cuts.
The pair came close to registering a new 44-month high near 1.3770 on June 26th, supported by sustained weakness in the U.S. dollar. At the time of this writing, it remains elevated, trading around 1.3712.
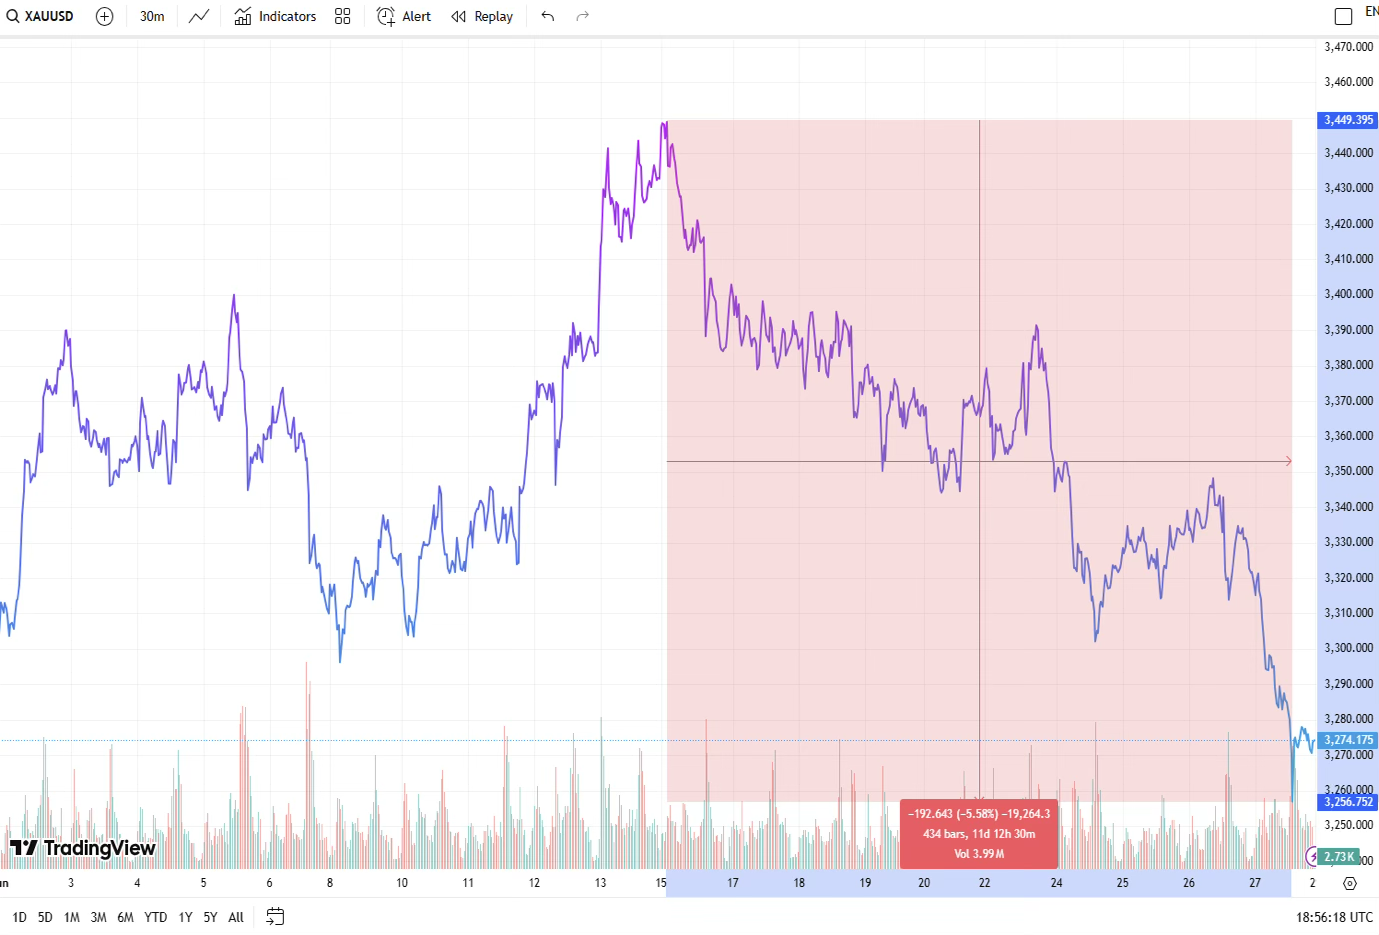
XAU/USD (Gold): An Independent Path
Gold (XAU/USD) forged a more independent path—initially rising with geopolitical risk but falling sharply after the ceasefire, even as the dollar weakened.
After nearing a high of $3,450 around mid-June, the precious metal showed a downward trend amid an improvement in risk appetite, driven by several factors: the de-escalation of the Iran-Israel conflict, the trade agreement between the U.S. and China, and ongoing negotiations between the U.S. and its trading partners to reach commercial deals. These developments were welcomed by investors, who had previously turned to bullion as a safe-haven asset. Additionally, the Fed’s resistance to cut rates weighed on Gold prices during this period, as lower interest rates typically benefit the non-yielding asset.
Ongoing pressure from Trump to cut rates, coupled with growing concerns over a potential economic slowdown, could prompt the Federal Reserve to adopt a more accommodative stance—potentially providing support for Gold. Furthermore, persistent geopolitical risks are expected to keep bullion prices elevated. The lack of meaningful progress in the Russia-Ukraine conflict, the crisis in Gaza, and broader tensions across the Middle East would continue to enhance Gold’s appeal as a safe-haven asset among risk-averse investors.
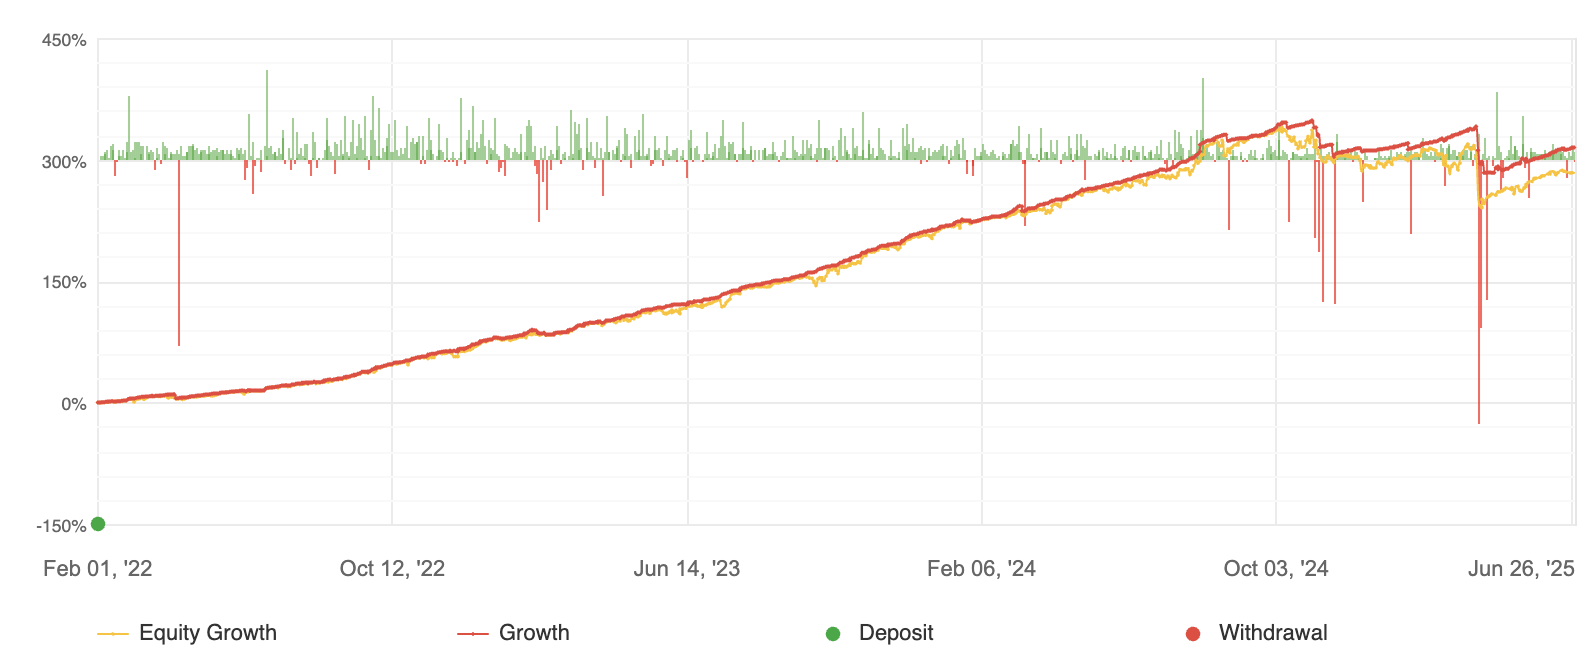
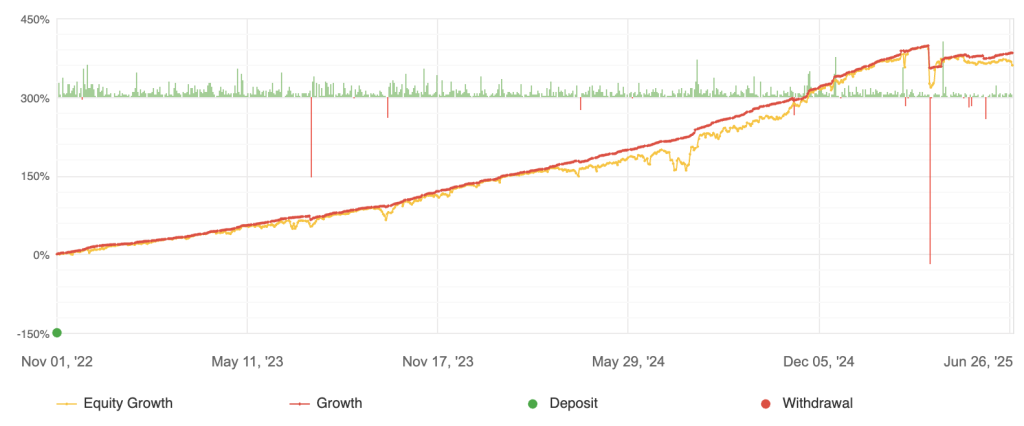
System Breakdown
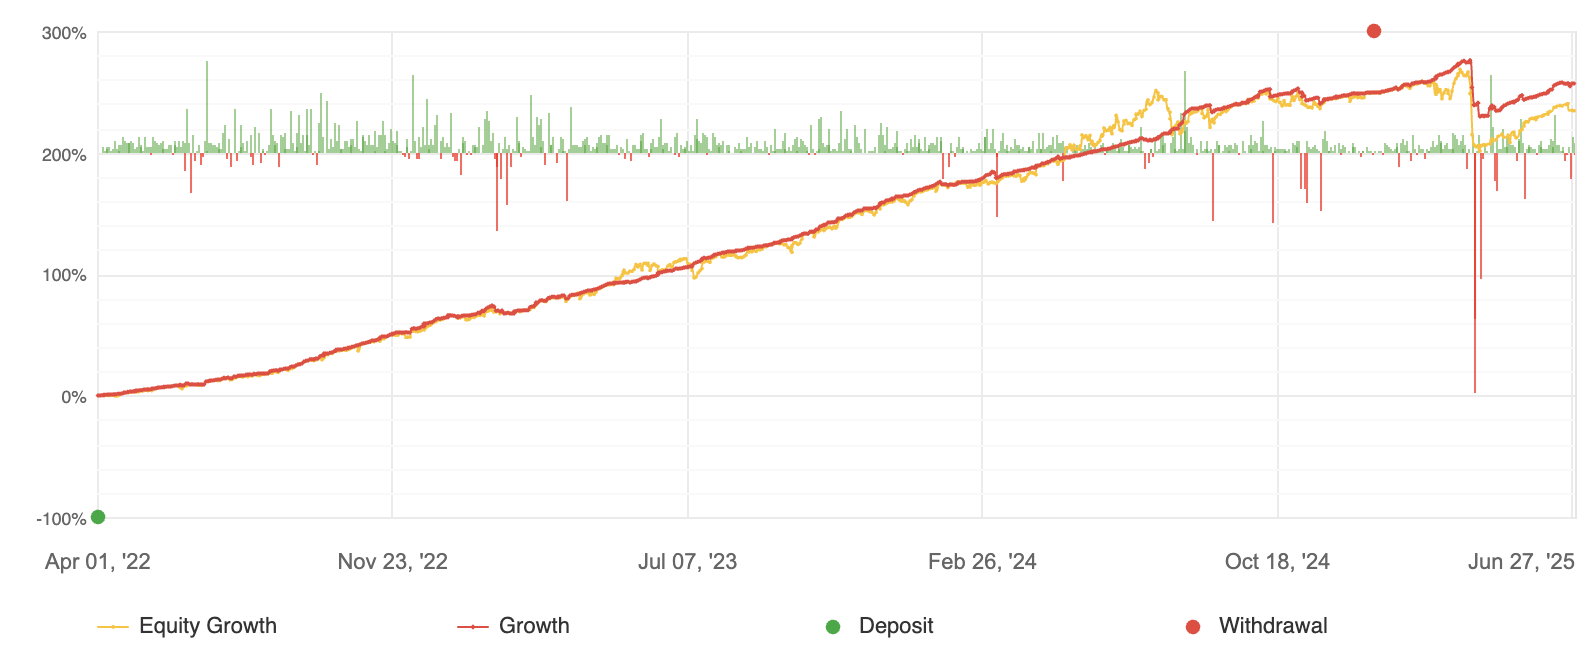
Despite a highly charged geopolitical environment and elevated market uncertainty, our R-50 and R-10 systems performed exceptionally well in June, delivering 2.98% and 2.83% respectively. These results demonstrate their robustness even under challenging conditions.
Both systems employ the same underlying trading strategies. The R-10, our more compact solution, applies a slight filter to smaller trades, making it suitable for a lower minimum deposit.
R-50
For the R-50, XAUUSD (Gold) long/short positions, EURUSD long, and AUDCAD long were the primary profit contributors. Conversely, EURNZD short, EURAUD short, and NZDUSD long positions incurred the largest losses.
The significant gains from XAUUSD long/short positions highlight the R-50’s ability to effectively capitalize on both sides of Gold’s price movements. It successfully benefited from safe-haven inflows in the first half of June and subsequently from outflows in the latter half, following the Iran-Israel ceasefire and the resulting shift towards risk-on sentiment. This performance underscores the system’s responsiveness and precision in adapting to evolving market conditions.
Additionally, the EURUSD long position delivered strong returns, driven by a sustained rally in the pair as the U.S. dollar remained under broad pressure throughout the month.
R-10
Meanwhile, the R-10’s top profit and loss contributors were EURUSD, CHFJPY, and XAUUSD.
R-10 entered 465 trades, boasting a higher win percentage of 76%, also with an average holding period of 48 hours
To ensure consistency and optimal performance, especially given the current market dynamics, all subsystems for both the R-50 and R-10 were thoroughly reviewed and re-calibrated at the end of June.
R-C30
After a period of robust returns over the past three months, our R-C30 system encountered significant headwinds in June, primarily due to heightened volatility across the Bitcoin and Ethereum markets. The system concluded the month with a drawdown of -4.91%. It’s important to note that this performance reflects the exceptionally challenging market conditions rather than any shift in the fundamental effectiveness of our strategy.
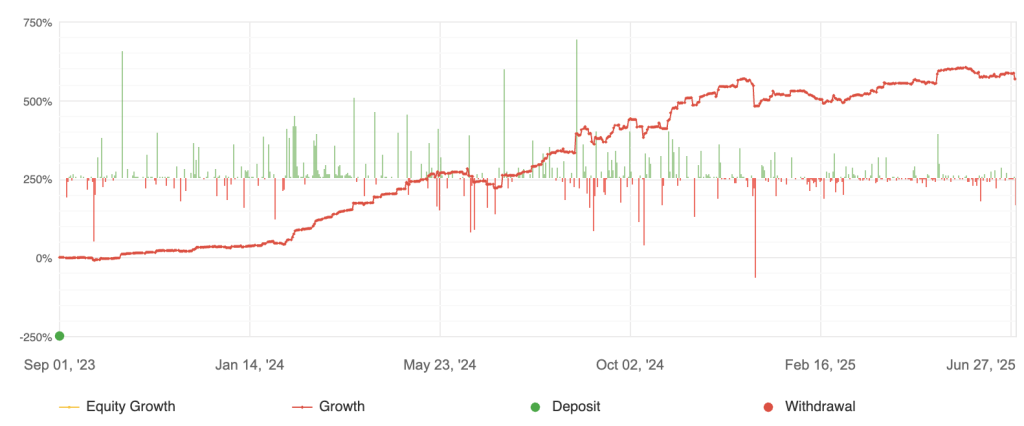
During this period, the R-C30 executed 309 trades, maintaining a win percentage of 61% with an average holding period of 15 hours and 27 minutes.
By the close of June, the system’s exposure was concentrated in just two key pairs: BTCUSD and ETHUSD.
Both of these pairs displayed erratic two-way price action. Notably, ETH/USD experienced a significant decline of nearly 26% between June 11th and June 22nd. While the pair has since seen a partial recovery, it remains considerably below its peak at the beginning of the month.
Meanwhile, Bitcoin’s heightened volatility in June was influenced by several factors: a substantial $40 billion options expiry event, escalating geopolitical tensions in the Middle East, and sharp institutional flows related to spot ETF activity. These elements, combined with unusually low implied volatility and the breach of key technical levels, frequently triggered intraday price swings of 2-4%.
At the end of June, the R-C30’s exposure was heavily concentrated in BTCUSD, accounting for nearly 78% of its total allocation.
We are confident in the R-C30’s adaptive capabilities and continue to monitor market dynamics closely to ensure optimal performance.
R-400
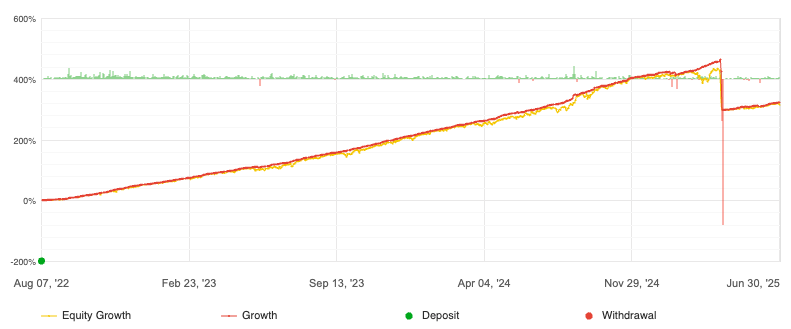
In a month characterized by a highly charged geopolitical environment and elevated market uncertainty, our R-400 strategy delivered a commendable performance, achieving a return of 2.56% despite the challenging conditions.
The R-400 system executed a total of 2,035 trades, maintaining a strong win percentage of 70% with an average holding period of approximately 24 hours.
Key Performance Contributors and Detractors
The primary profit drivers for the R-400 were EURUSD long/short positions, AUDCAD long/short, and NZDUSD long. On the other hand, GBP/USD short and EUR/NZD short positions were notable detractors from the overall performance.
The gains realized from the EUR/USD long/short trades underscore the R-400’s strategic agility. It successfully navigated a broadly bullish trend for the pair while adeptly capitalizing on short-term corrections. Even as the EUR/USD experienced a sustained rally throughout the month, specific sharp pullbacks—particularly around significant macroeconomic and geopolitical events—created profitable opportunities for short positioning.
Conversely, the loss on the GBP/USD short position reflects the pair’s strong rally late in the month, which coincided with a notable weakening of the U.S. dollar.
Exposure at Month-End
By the close of June, the top three currency pairs in terms of exposure for the R-400 were EURUSD short, AUDCAD short, and EURGBP short.
To ensure continued consistency and optimal performance, especially in light of the prevailing market conditions, all underlying subsystems within the R-400 were thoroughly reviewed and re-calibrated at the end of June.
R-X25
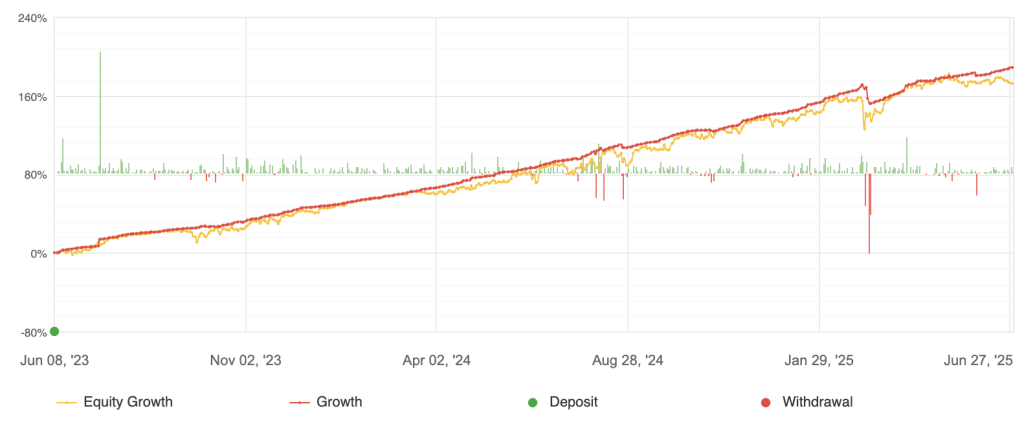
Despite a month marked by a highly charged geopolitical environment and elevated market uncertainty, our R-X25 system demonstrated resilience, delivering a modest return of 0.99% in June.
The R-X25 executed 1,210 trades during the month, achieving a win percentage of 67% with an average holding period of approximately 12 hours. A notable indicator of the system’s efficiency in a chaotic environment was its Profit Factor, which stood at 1.50 – representing the ratio of total profits to total losses.
Key Performance Contributors
The largest profit contributors to the monthly performance of the R-X25 were XAUUSD (Gold) long/short positions, AUDCAD long, and EURUSD short. Conversely, GBPUSD short and EURAUD long positions incurred losses.
The gains from the XAUUSD long/short positions highlight the R-X25’s adeptness at capturing both sides of Gold’s price action. The strategy successfully benefited from safe-haven inflows during the first half of June and subsequently from outflows in the latter half, following the Iran-Israel ceasefire and the resulting shift towards a risk-on sentiment. This performance underscores the system’s responsiveness and precision in adapting to evolving market conditions.
Exposure at Month-End
By the close of June, the R-X25 held substantial exposure to EURUSD short and USDCHF long.
To ensure ongoing consistency and optimal performance, especially in light of the prevailing market conditions, all underlying subsystems within the R-X25 underwent a thorough review and re-calibration at the end of June.
R-X5
Despite a highly charged geopolitical environment and elevated market uncertainty, our R-X5 system demonstrated its stability in June, delivering a modest but positive return of 1.07%.
The R-X5 executed 465 trades during the month, maintaining a strong win percentage of 71% with an average holding period of 24 hours. Its Profit Factor stood at 1.43 (the ratio of total profits to total losses), reflecting a robust system-level efficiency even amidst the chaotic market backdrop.
Key Profit Drivers and Detractors
EURUSD long/short positions, XAUUSD (Gold) long, and CHFJPY long were the primary contributors to the R-X5’s monthly profit. The only notable detractor was the GBPUSD short position.
The gains from the XAUUSD long/short positions underscore the R-X5’s strategic ability to effectively capture both sides of Gold’s price action. The system successfully benefited from safe-haven inflows during the first half of June and subsequently from outflows in the latter half, following the Iran-Israel ceasefire and the resulting shift towards risk-on sentiment. This performance highlights the system’s responsiveness and precision in adapting to evolving market conditions.
Conversely, the loss on the GBP/USD short position likely reflects the pair’s strong rally towards the end of the month, which coincided with a notable weakening of the U.S. dollar.
Exposure Snapshot at Month-End
By the close of June, the top three pairs in terms of R-X5’s exposure were GBPCHF long, EURGBP short, and AUDCAD short.
To ensure continued consistency and optimal performance, especially in light of the prevailing market conditions, all underlying subsystems within the R-X5 were thoroughly reviewed and re-calibrated at the end of June.