
The Dollar’s Summer Surge: A Look at July’s Forex Trends
Since the beginning of 2025, the global forex markets have been on a roller coaster. Key drivers of this volatility include significant macroeconomic shifts in the United States and the unpredictable nature of global politics. The current US administration’s policies, particularly those directly impacting the markets, have only amplified this uncertainty.
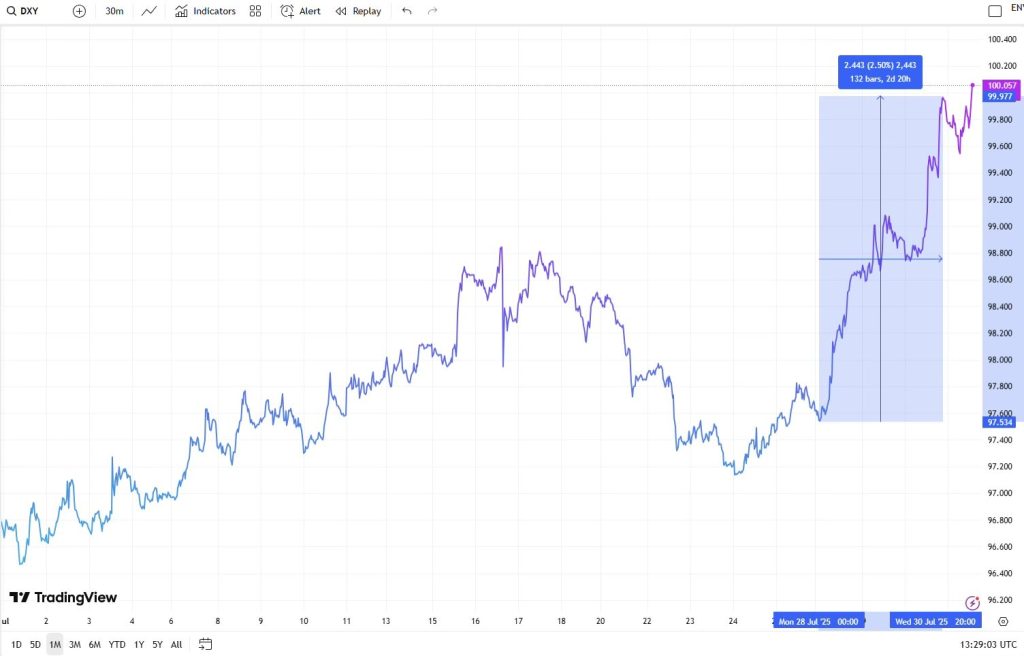
Following a three-month trend, July continued to be defined by this high level of market volatility, heavily influenced by the movements of the US dollar. However, July was unique in one crucial way: the US Dollar Index (DXY), which tracks the dollar’s value against a group of six major currencies, recorded its first monthly gain of the year. By the end of July, the DXY had climbed just above the psychologically significant $100 mark, a level it hadn’t reached since May 2025.
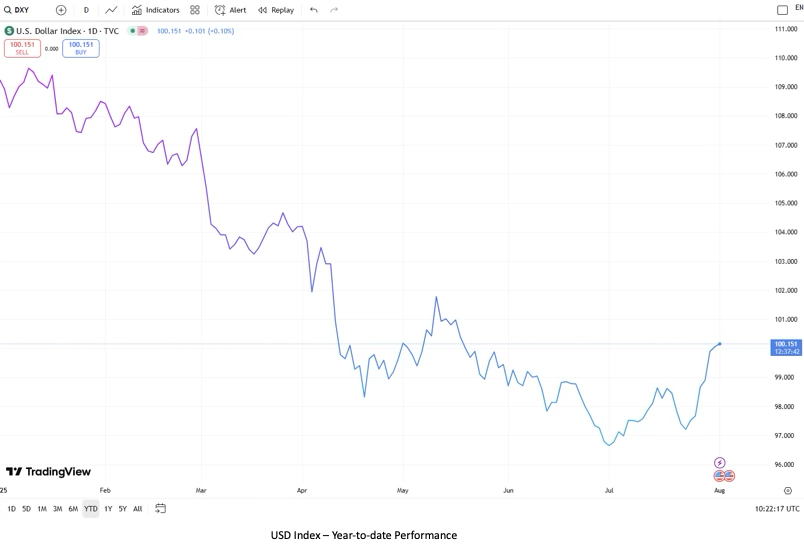
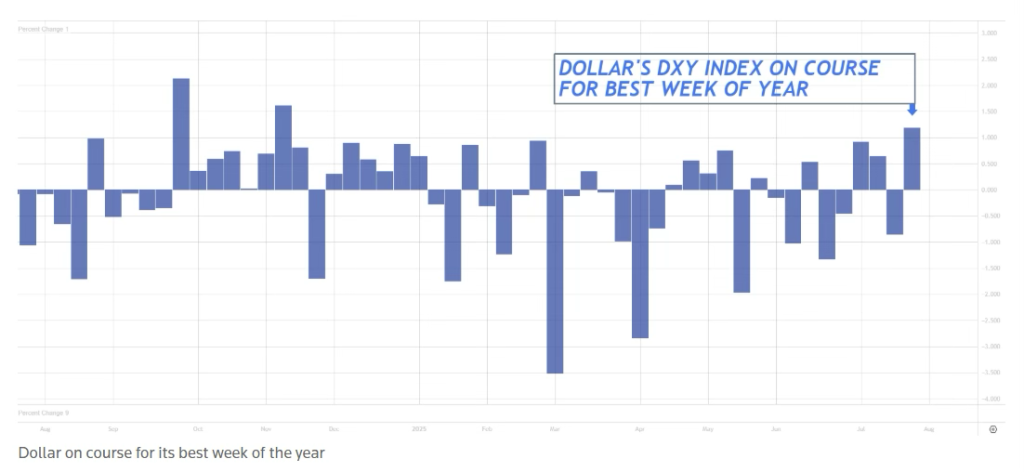
Overall, in July, the US dollar index exhibited distinct two-way directional movements, yet trending broadly upward throughout the month, posting its best weekly performance of the year in the final week.
July began with a bang. The release of surprisingly strong non-farm payrolls data showed a gain of 147,000 jobs in June, significantly exceeding the forecast of 110,000. This robust labor market report led markets to believe that the Federal Reserve would be unlikely to cut interest rates at its July meeting. This new outlook on monetary policy set the stage for a powerful rally in the US dollar.
The rallying US dollar gained even more steam after President Trump renewed his tariff threats, sparking fears of a trade war and triggering a wave of risk aversion. As investors fled from riskier assets, they sought refuge in the dollar, a traditional safe-haven currency. This “flight to safety” pushed the reserve currency higher, a trend that lasted through mid-July and helped the dollar recover from its earlier lows.
A Mid-Month Pullback
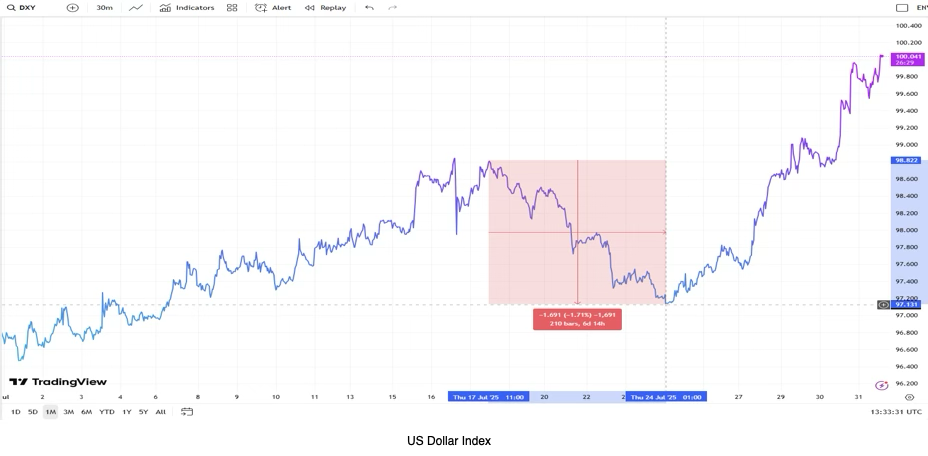
From July 17 to 24, the US dollar experienced a notable downturn. This was fueled by rising optimism around global trade, as progress was made on new tariff agreements between the US and the EU, and the US and Japan. These developments eased market tensions, boosting investor confidence and prompting a shift away from safe-haven assets like the dollar.
Additionally, even with strong domestic economic data—like a better-than-expected rebound in June retail sales and a decline in weekly jobless claims—investors began to temper their expectations for an imminent interest rate hike by the Federal Reserve. This reassessment of monetary policy further added pressure on the dollar, contributing to its mid-month retreat.

End-of-Month Reversal
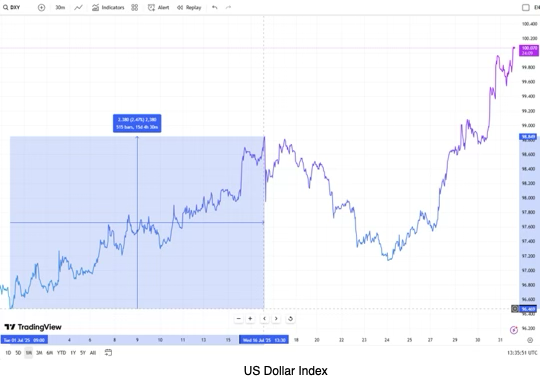
The dollar’s downward trend was sharply reversed in the final days of July, driven by a powerful mix of positive economic data and trade developments. The initial catalyst was a trio of strong macroeconomic reports.
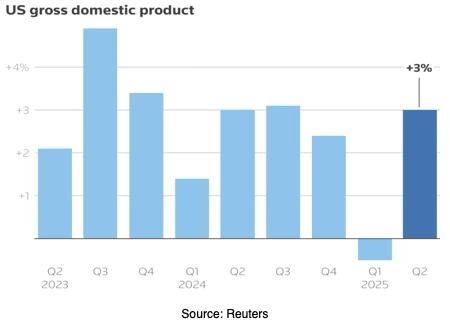
First, the ADP Employment Change report revealed that the private sector added 104,000 new jobs in July, handily surpassing the 78,000 jobs analysts had expected. This was followed by the preliminary estimate for Q2 Gross Domestic Product (GDP), which showed a robust expansion of 3% annually—a significant improvement over both the anticipated 2.4% and the previous quarter’s contraction of 0.5%. Finally, the core Personal Consumption Expenditures (PCE) Price Index, a key inflation measure for the Federal Reserve, rose by a more moderate 2.5% in the same quarter, a welcome decrease from the 3.5% recorded in the first three months of the year.
The dollar’s slide, however, came to an abrupt halt and reversed course toward the end of July. This reversal was powered by a perfect storm of positive economic data and encouraging trade news.
The macroeconomic push came first, with a series of three highly favorable reports. The ADP Employment Change report kicked things off, showing that the private sector added a robust 104,000 jobs in July—comfortably exceeding the 78,000 forecast. This was followed by the preliminary estimate for Q2 Gross Domestic Product (GDP), which revealed that the US economy had expanded at an impressive 3% annual rate. This figure not only surpassed the 2.4% expectation but also marked a strong rebound from the 0.5% contraction in the first quarter. To cap it off, the core Personal Consumption Expenditures (PCE) Price Index, a key measure of inflation, showed a more moderate increase of 2.5% for the quarter, down from 3.5% in the preceding three months.
These strong figures highlighted the unexpected resilience of the US economy, providing the Federal Reserve with justification to maintain its “patience” on monetary policy. While markets had already priced in the likelihood of no rate cut at the Fed’s July meeting, the release of this data, coupled with hawkish comments from Fed Chairman Powell, diminished expectations for a September cut as well, giving a significant boost to the US dollar.
To further boost the dollar’s strong momentum, the United States and the European Union signed a new trade agreement on July 28. The deal, widely criticized in Europe as one-sided and heavily skewed in favor of the US, triggered a swift reaction in the markets. Over the next two days, the US Dollar Index (DXY) surged by approximately 2.5%, climbing to just above the $100 mark, a level it hadn’t reached since May 2025.
EUR/USD: A Tale of Two Halves
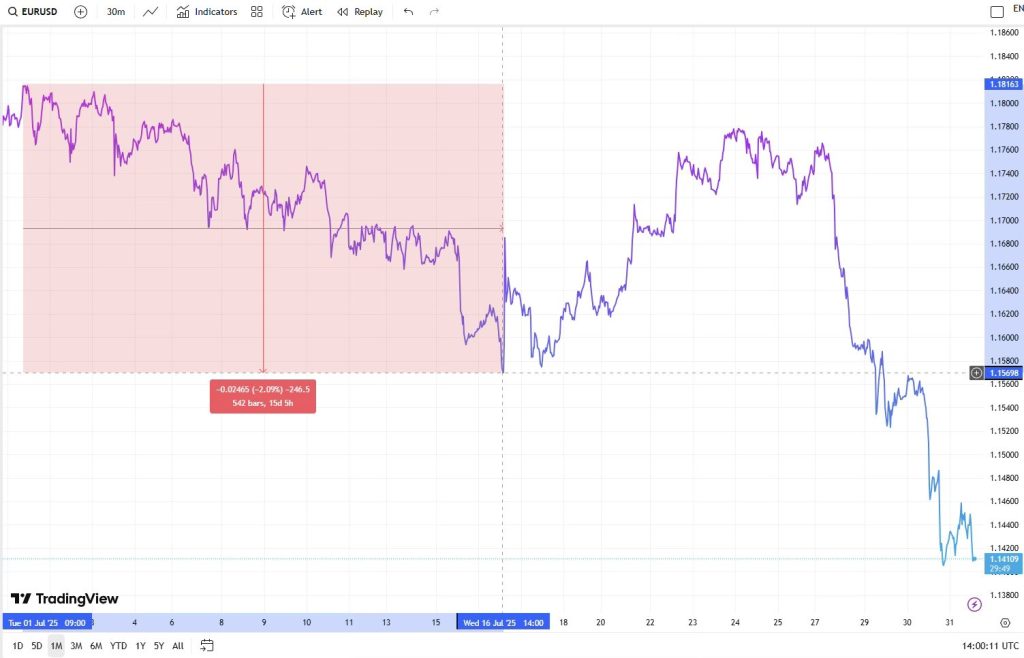
Echoing the trend from earlier in the year, the US dollar was the primary driver of currency pair movements throughout July. The EUR/USD pair trended downward during the first half of the month. This was a direct result of the dollar’s growing strength, which was fueled by positive non-farm payroll data and a rise in risk aversion stemming from global trade concerns. The euro found only limited support from comments by European Central Bank (ECB) officials, who suggested that interest rates would likely remain unchanged at their upcoming meeting, following eight consecutive rate cuts since June 2024. This divergence in economic sentiment led to the unsteady, downward price action for the EUR/USD pair in early July.
The turning point arrived on July 17, as positive news about easing US-EU trade tensions boosted market sentiment. Reports that negotiators were nearing a deal with less severe tariffs than initially feared helped to alleviate pressure on the euro, which had been underperforming due to the earlier trade uncertainty.
At the same time, the narrowing gap in monetary policy between the US and the eurozone gave the euro some breathing room. Despite strong US labor market data, a further tightening of policy by the Federal Reserve seemed unlikely. Meanwhile, a Reuters poll indicated that the ECB was expected to hold rates steady at its upcoming meeting, signaling no urgency for additional easing following eight consecutive deposit rate cuts. These combined developments helped the EUR/USD pair recover nearly all of its early losses.
The EUR/USD pair, however, dropped sharply in the final week of the month as the US dollar logged its strongest weekly performance, bolstered by upbeat US macroeconomic data and the new US-EU trade agreement. The euro remained under pressure following the trade deal, which was widely seen as far more beneficial to the US than the EU.
This bearish outlook for the EUR/USD pair was further supported by positioning data from the Commodity Futures Trading Commission (CFTC). As of July 22, large speculators held over 128,000 net-long Euro futures contracts, indicating a strong bullish sentiment. However, with the euro under pressure late in the month, the market appeared to be unwinding these positions as traders took profits following the single currency’s strong first-half rally. Against this backdrop, the EUR/USD pair fell by more than 3% between July 28—the day the US-EU deal was announced—and July 30.
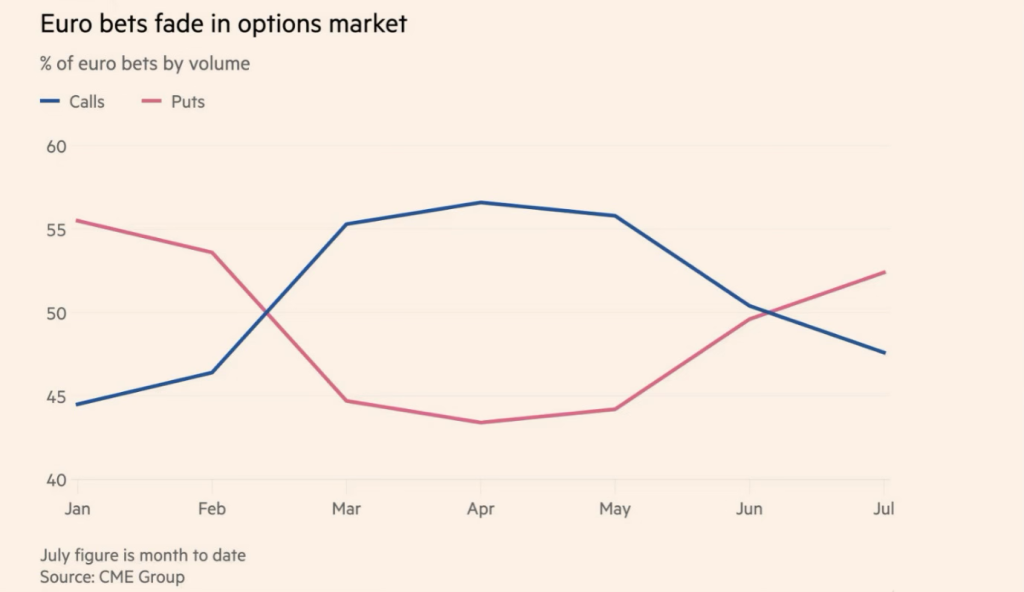
The options market also reflected this shift, registering a notable increase in demand for euro puts, which underscored growing bearish sentiment and waning investor confidence in the single currency.
GBP/USD: Navigating US Strength and UK Concerns
While the GBP/USD pair was also heavily influenced by the US dollar’s movements, developments within the UK economy played a significant role in its July performance. The month began with the pair at its highest point of the year. However, this rally was short-lived. A combination of the broad US dollar strength—driven by positive US data and rising risk aversion—and growing concerns about the UK’s fiscal health and weaker economic outlook led to a sharp decline. The GBP/USD pair fell by nearly 3% during the first half of July.
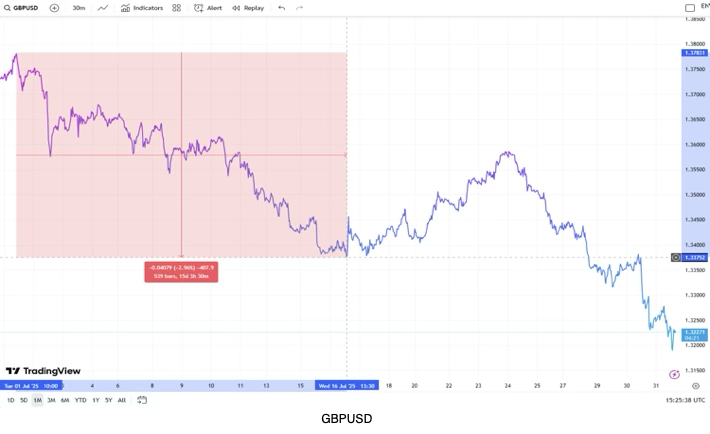
The tide turned again on July 17, with markets reacting positively to news of easing trade tensions between the US and the EU. This boosted risk sentiment and encouraged a shift of capital away from safe-haven assets like the US dollar. Simultaneously, stronger labor market data prompted markets to scale back expectations of further tightening by the Federal Reserve, creating another headwind for the dollar. As a result, the GBP/USD pair experienced a sharp rally between July 17 and 24.
The final week of July, however, saw the pair fall for six consecutive days, bringing it down to levels last seen in mid-May. This decline was fueled not only by the US dollar’s strongest weekly performance of the year, but also by growing investor certainty that the Bank of England would cut interest rates at its upcoming August meeting, a decision seemingly supported by signs of a cooling UK labor market.
AUD/USD: A Volatile Month Driven by Trade and Policy
The AUD/USD pair was exceptionally volatile in July, driven by fluctuations in the US dollar, shifting US-China trade dynamics, and developments within the Australian economy. Given Australia’s significant trade relationship with China, the pair is particularly sensitive to China’s macroeconomic health.
As with other major currency pairs, the AUD/USD began July on a downward trend. The US dollar rallied in the first week, propelled by positive US economic data and a risk-off market sentiment that favored the greenback’s safe-haven status. However, the pair staged a sharp rebound, rallying by about 1.66% between July 8 and 10 after the Reserve Bank of Australia unexpectedly chose to hold its main interest rate at 3.85%.
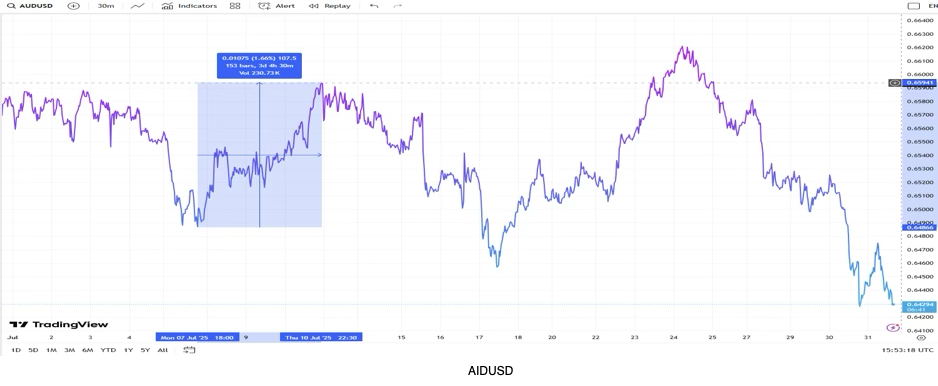
The rally, however, lacked follow-through, and the pair resumed its downward trend until mid-July as the US dollar was supported by the growing certainty that the Federal Reserve would not cut rates at its July meeting.
Like other major pairs, the AUD/USD rebounded between July 17 and 24. This was driven by easing US-EU trade tensions, which boosted risk appetite, and strong US labor data, which tempered expectations of further Fed tightening.
The final week of July, however, saw the US dollar post its best weekly performance of the year, pushing the AUD/USD pair to new monthly lows. At the close of the month, the pair was trading at approximately 0.6428.
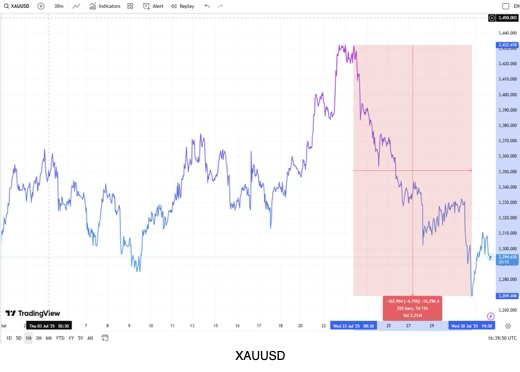
Gold (XAUUSD): A Month of Shifting Safe-Haven Demand
Gold (XAUUSD) exhibited strong volatility during the month. The pair fell by 0.8% at the start of the month as a strong US non-farm payrolls report led market participants to dial back expectations of a Fed rate cut in July, strengthening the US dollar.
In addition, the pair faced further pressure as markets welcomed news that reciprocal tariffs would take effect on August 1 instead of July 9, boosting risk appetite and reducing safe-haven demand for gold. The precious metal declined on hopes that additional trade deals might be announced before the tariffs come into force.
However, the decline was short-lived, as renewed global trade concerns and aggressive posturing by Trump quickly revived demand for gold as a safe-haven asset around July 9.
The pair’s broad upward price action continued until July 23, when news that the US and the EU were close to signing an agreement, similar to the one signed by the US and Japan earlier in the month, lifted market risk sentiment and, once again, dampened the bullion’s safe-haven demand.
Fueling the descent, the US dollar logged its strongest weekly performance in the final week of July, buoyed by upbeat US macroeconomic data and the finalization of the US-EU trade agreement.
Between July 23 and 30, the XAUUSD pair declined by approximately 4.75%, trading at a monthly low of 3,295 at the time of writing.
The precious metal’s trajectory is especially tied to the ongoing trade negotiations between the US and China. A failure to reach an agreement could lead to a re-escalation of tariffs, reigniting fears of inflation and complicating the Federal Reserve’s monetary policy decisions. Such a scenario would likely be beneficial for gold, which is traditionally seen as a safe-haven asset during times of heightened uncertainty.
System Breakdown
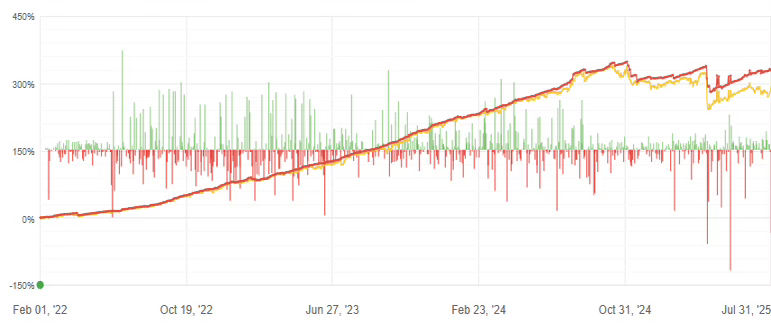
R-10 & R-50
In a turbulent market environment marked by shifting risk sentiment, both R-50 and R-10 performed well in July, delivering returns of 2.79% and 2.73%, respectively.
Both systems use the same core subsystems, with the R-10 applying a slight filter on smaller trades to accommodate a lower minimum deposit.
For R-50, short EUR/USD, both long and short XAU/USD (Gold), and long and short AUD/CAD were the biggest contributors to its profit and loss. The largest losses came from short EUR/AUD, long GBP/JPY, and short EUR/JPY positions.
The short EUR/USD strategy benefited from the dollar’s sustained strength throughout the month, which was initially driven by safe-haven demand amid rising global trade tensions and later supported by strong US macroeconomic data and progress on trade agreements.
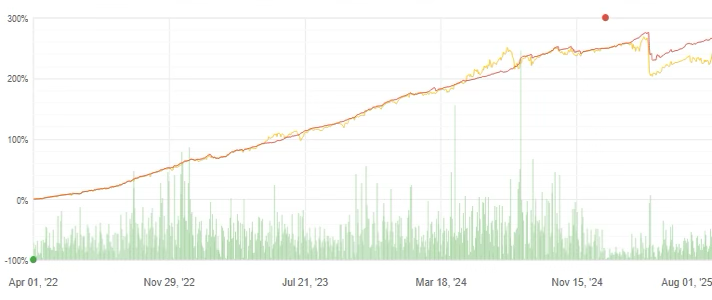
Meanwhile, the gains from the XAU/USD long and short positions demonstrated the strategy’s agility in capturing both sides of gold’s price swings. It capitalized on safe-haven inflows between July 9 and 23 and then profited from outflows in the final week as risk sentiment improved and the US dollar posted its strongest weekly performance of the year.
The top profit and loss contributors for the R-10 system were EUR/USD, EUR/GBP, and XAU/USD.
During the period, R-50 entered 2,441 trades, with a 62% win rate and an average holding period of 3 days. R-10, meanwhile, entered 604 trades, with a 63% win rate and an average holding period of 1 day.
All subsystems were thoroughly reviewed and re-calibrated at the end of July to ensure consistency and optimal performance, especially in light of the prevailing market conditions.
R-C30
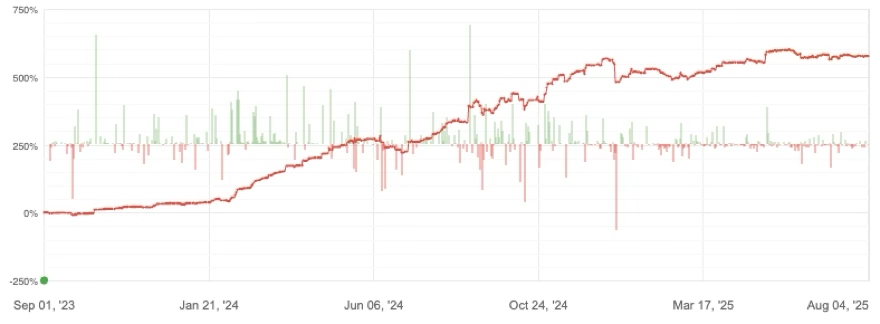
R-C30, which holds both long and short exposures across BTC/USD and ETH/USD, ended July with a below-average return of 1.53%.
The system executed 319 trades, with a win percentage of 71% and an average holding period of 10 days. The profit factor was 1.29, showing good system-level efficiency. The month-to-date drawdown was also low at just 1.66%, indicating stability during this period. While performance has been subdued for an extended period, all subsystems are showing good signs of traction, and we anticipate larger gains ahead.
While BTC/USD trades generated a slight profit, the ETH/USD positions yielded a much higher return. This is uncharacteristic for our system, as BTC/USD typically dominates both trading volume and PnL. The low activity in BTC/USD was due to significant moves that were avoided by several risk-limitation mechanics.
By the end of July, the system’s exposure was heavily concentrated in BTC/USD, accounting for almost 88% of the total exposure.
R-X25
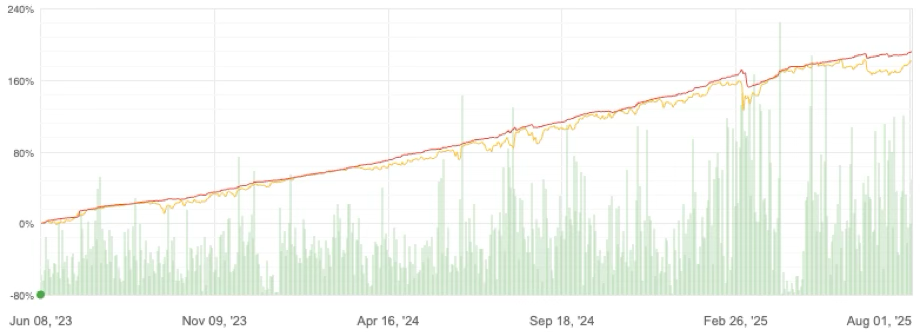
In a turbulent market environment marked by shifting risk sentiment, R-X25 was able to deliver a solid, but below average return of 1.38% in June.
The system executed 1,594 trades, with a win percentage of 59% and an average holding period of approximately 24 hours. The Profit Factor stood at 1.25, reflecting decent system-level efficiency amidst a chaotic environment.
Long/short XAU/USD, long/short AUD/CAD, and long USD/JPY were the biggest profit contributors to the monthly P&L, while short BTC/USD and short USD/CHF positions incurred losses.
The directional XAU/USD trades gained from the dollar’s sharp late-month rally, which was fueled by strong US macroeconomic data and finalized trade deals with key partners, most notably the European Union.
R-X25 was re-synced and optimized for the current market environment at the end of July.
By July-end, the system mainly held exposure to long USD/CHF, long GBP/USD, and long GBP/CHF.
All subsystems were thoroughly reviewed and re-calibrated at the end of July to ensure consistency and optimal performance, particularly in light of the prevailing market conditions.
R-X5
In a turbulent market environment marked by shifting risk sentiment, R-X5 faced headwinds and posted a return of only 1.52%, underscoring the challenges of navigating such volatile conditions.
The system executed 533 trades, with a win percentage of 62% and an average holding period of 24 hours.
Long/short AUD/CAD, long/short XAU/USD, and long/short AUD/JPY were the biggest contributors to profit, while long GBP/JPY, short EUR/CAD, and long USD/CHF were the notable detractors.
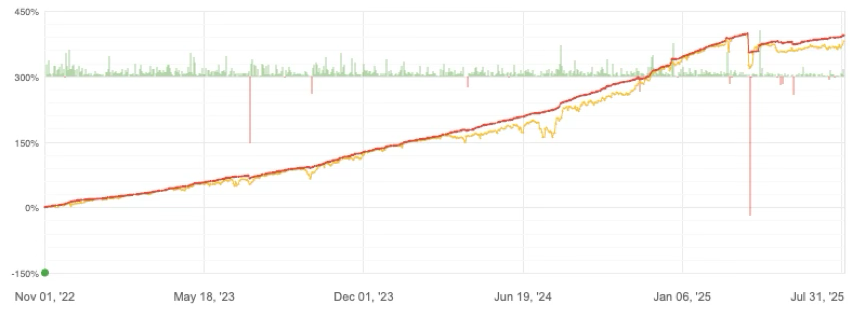
The nature of the R-X5 system is adaptive. In some cases, the changing subsystem infrastructure can lead to slight short-term deviations between master and slave accounts. This is expected, but the infrastructure is optimized to align master and slave performance in the long run.
Amid heightened uncertainty and erratic price action across major currency pairs, the system faced challenges in distinguishing meaningful directional trends from short-term market noise. This environment of frequent reversals and low-conviction moves limited the strategy’s ability to generate consistent signals, ultimately impacting performance.
By July-end, the top three pairs in terms of exposure were short CHF/JPY, long GBP/CHF, and long GBP/USD.