
August: A Month of Indifference for the US Dollar
The US dollar spent August in a state of indifference, caught between support and resistance as mixed economic data, political uncertainty, and rapid market shifts created a lack of clarity. Despite a strong start to the month, the initial optimism quickly faded.
The first day of August saw the dollar’s momentum reverse sharply. The US Nonfarm Payrolls (NFP) report showed significantly weaker job growth than expected, with only 73,000 jobs added versus the 110,000 anticipated. Furthermore, the job figures for May and June were revised down by a combined 258,000.
This data, which signaled a potential economic slowdown, led the market to believe the Fed would lower interest rates in September. This belief, along with the resignation of Fed Governor Adriana Kugler, who was expected to be replaced by a more dovish appointee, fueled a significant selloff. This downward trend continued throughout the first half of the month.
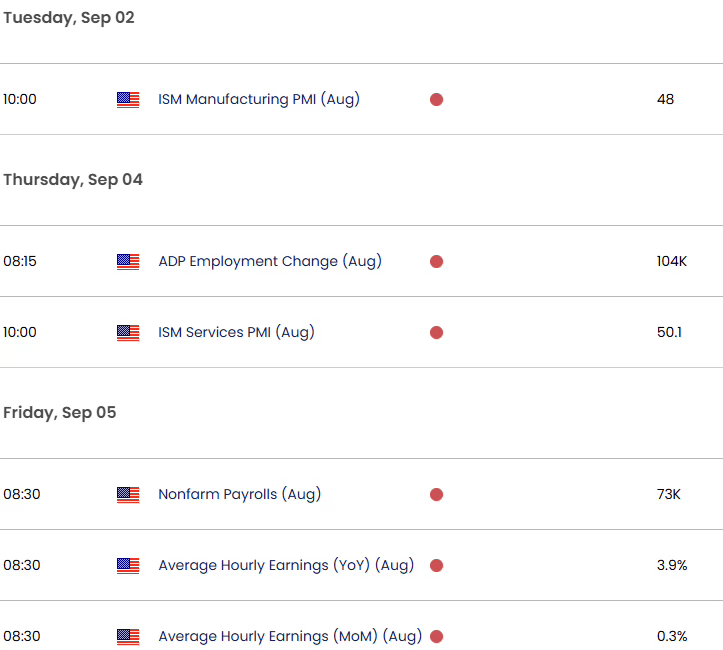
The dismal US NFP report was quickly followed by more disappointing news, as the ISM Manufacturing PMI revealed that manufacturing activity contracted for the fifth consecutive month in July, falling to 48.0 from 49.0 and missing expectations of 49.5. This was compounded by a weakening in the University of Michigan Consumer Sentiment for June.
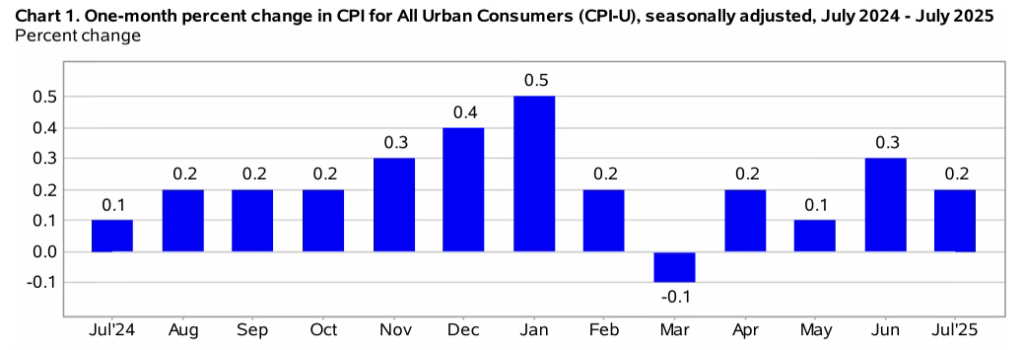
The dollar faced further pressure on August 12 when data from the Bureau of Labor Statistics showed that the Consumer Price Index (CPI) rose by 0.2% month-over-month, matching forecasts. However, the annual rate remained at 2.7%, just below the expected 2.8%.
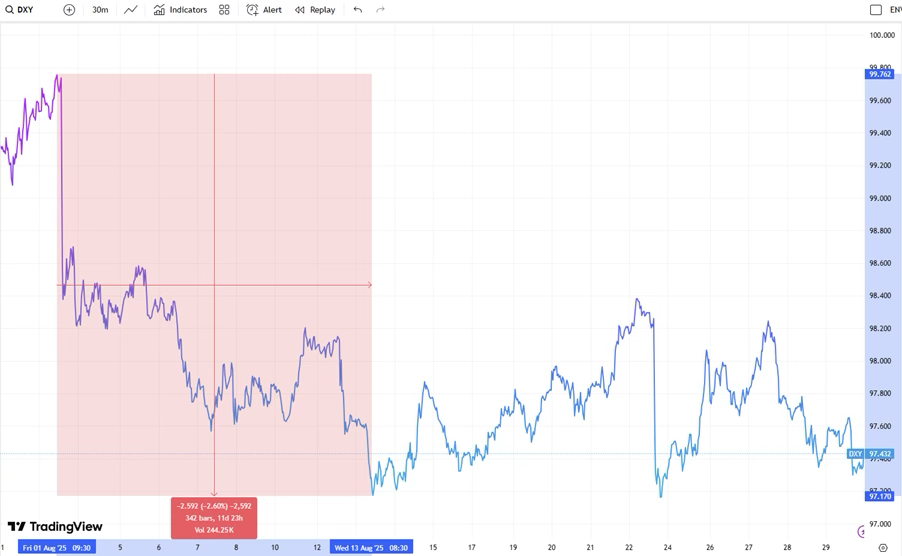
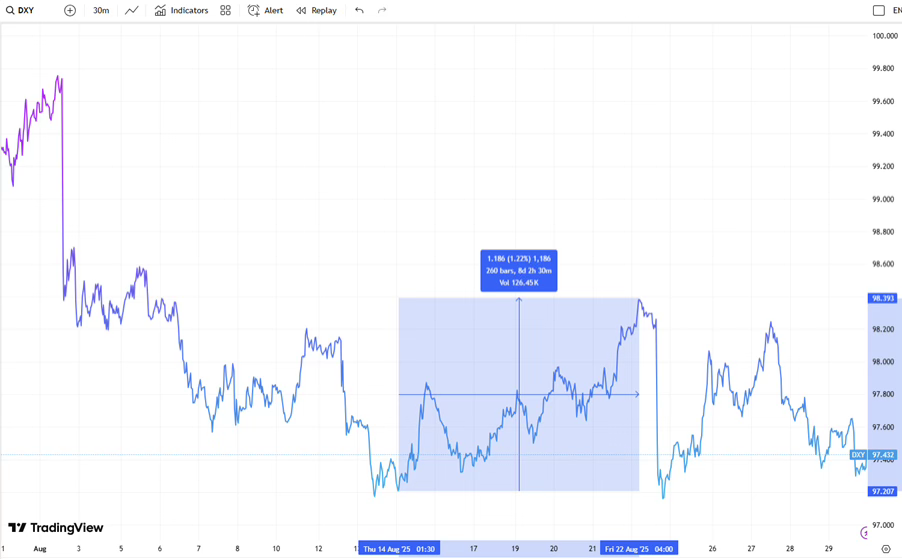
Following a 2.6% decline during the first two weeks of August, the US dollar staged a turnaround between August 14 and 22. This recovery was driven by a report showing that the US Producer Price Index (PPI) saw its largest increase in three years in July, fueled by a surge in the costs of goods and services. The PPI data caused traders to scale back their expectations of a September interest rate cut, which in turn provided support for the dollar.
The dollar found more support after the release of optimistic Purchasing Managers Index (PMI) data, which showed strong momentum in the US economy. The Composite PMI increased to 55.4 (from 55.1), and the Manufacturing PMI rebounded significantly to 53.3 (from 49.8), exceeding the expected 49.5 and signaling a return to expansion. Meanwhile, the Services PMI remained strong at 55.4 (compared to 55.7 previously and 54.2 expected).
The reprieve for the US dollar was short-lived. The US dollar index fell sharply on August 22 following a speech by Federal Reserve Chair Jerome Powell at Jackson Hole, which had a distinctly dovish tone. Powell indicated that labor market weakness might soon become a greater concern than inflation, and he also suggested that the inflationary impact of tariffs would likely be temporary.
These comments led to significant selling pressure on the dollar, causing it to drop by over 1.25% in a single day. Traders began to price in a 25-basis-point rate cut at the Fed’s September meeting and a 50-basis-point cut by year-end.
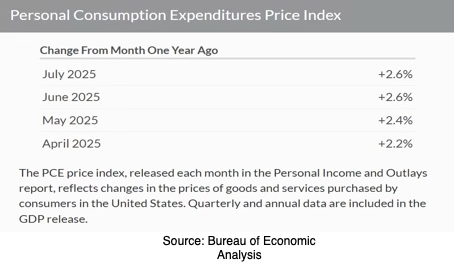
However, a swift rebound occurred the following Monday as traders reconsidered their dovish positions. The index recovered above 98.3 before again declining amid new concerns about the Fed’s independence and potential political interference in central bank leadership. The month concluded with additional challenges for the dollar, as the US Personal Consumption Expenditures (PCE) Price Index rose by a modest 0.2% month-on-month and 2.6% year-on-year, both figures meeting expectations. Sources
Even though two crucial reports—the August Consumer Price Index (CPI) and Nonfarm Payrolls—are still to be released before the Fed’s September meeting, market participants appear confident that the central bank will initiate its easing cycle. The CME FedWatch Tool currently indicates an 86.4% probability of a 25-basis-point rate cut at the upcoming meeting.

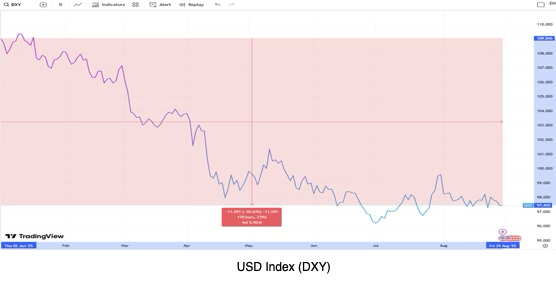
The dollar has taken a significant hit, falling by 2.33% since the beginning of August to trade at 97.432. Its year-to-date performance is even more dramatic, with the Greenback having dropped by a staggering 10.63%.
The US dollar’s decline has benefited other major currencies. After being under pressure in July, pairs like EUR/USD, GBP/USD, AUD/USD, and Gold (XAU/USD) all rebounded in August, driven by the Greenback’s weakness.
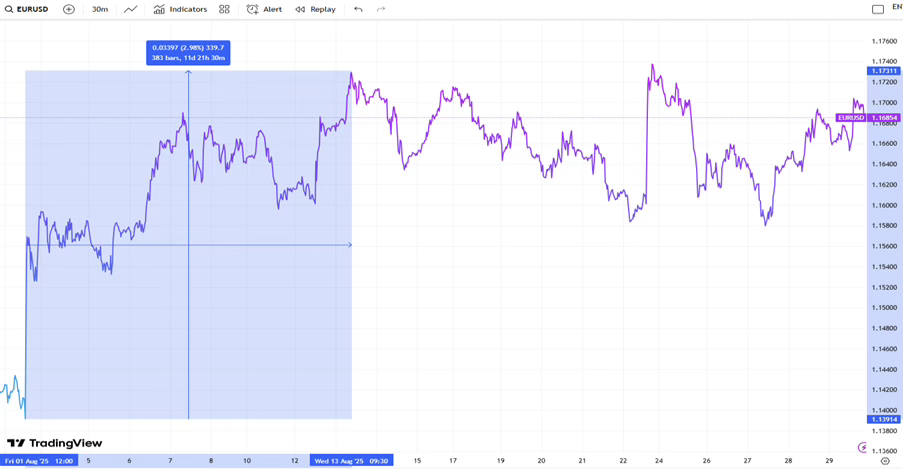
The EUR/USD pair, in particular, found significant relief. Following a sharp drop in July, the pair began August on a strong note, rising by over 1% on August 1. This rally was triggered by a disappointing US NFP report, which prompted investors to anticipate two Fed rate cuts by the end of the year. The pair’s rally continued, fueled by further negative US economic data, including a weak PMI report, falling consumer confidence, and on-target CPI figures. These factors weighed on the US dollar and helped EUR/USD gain nearly 3% between August 1 and 13. Sources
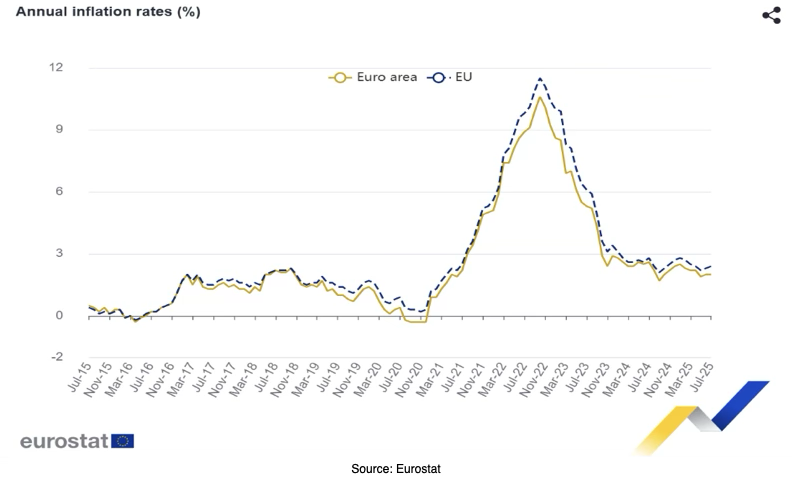
On the euro side, the currency found support as traders began to price in a pause from the European Central Bank (ECB) at its September meeting. Odds of unchanged interest rates rose to about 87% by the end of the first week of August, particularly after inflation in the euro area held steady at 2% in July.
After that initial upward movement, the EUR/USD pair trended lower between August 14 and 22. This was due to the US dollar strengthening on the back of stronger-than-expected PPI and PMI data.
The key turning point was on August 22, when EUR/USD surged after Fed Chair Jerome Powell’s dovish speech at Jackson Hole, which signaled a likely return to an easing cycle. The pair jumped by about 1.2% on that day alone.
However, the following Monday saw a correction as traders engaged in profit-taking, causing the pair to retreat by nearly 1%. This decline was made worse by European Central Bank (ECB) President Lagarde’s cautious outlook on the Eurozone, where she noted modest growth expectations of 1% for 2025 and mentioned the continued pressure on exports from high US tariffs.
Despite this, the EUR/USD pair resumed its upward trend by the end of the month. This was prompted by the release of the US PCE Price Index on August 29, which met expectations and reinforced bets for a September Fed rate cut, putting more pressure on the dollar.
The GBP/USD pair’s movements were also largely dictated by the US dollar, closely mirroring the pattern of EUR/USD. However, it seemed to be slightly more reactive to US dollar fluctuations, as UK data releases often amplified the moves already initiated by US news.
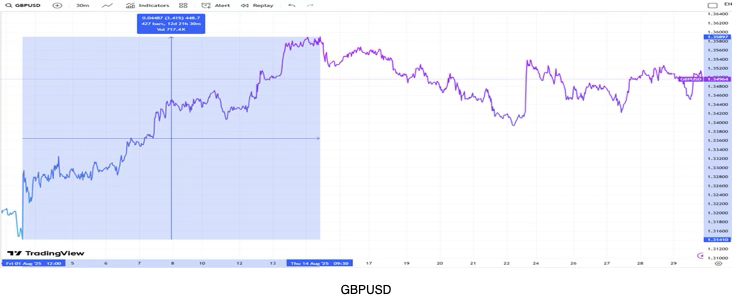
Similar to EUR/USD, the GBP/USD pair experienced a sustained upward trend between August 1 and 14, as several factors converged to support it. The disappointing US jobs report on August 1 led to selling pressure on the dollar, giving the pound a strong start to the month.
Further support came from a hawkish rate cut by the Bank of England (BoE) in early August. Although a rate cut was widely expected, the pound strengthened after the market was surprised by the narrow 5-4 vote, with more members than anticipated voting to hold rates steady. This momentum continued into mid-August, bolstered by on-target US CPI data that pressured the dollar, as well as strong UK GDP and factory output figures.
From August 14 to 22, GBP/USD trended downward as the US dollar regained some of its earlier losses. This was driven by better-than-expected PPI and PMI data, which lowered expectations for a September Fed rate cut.
The turning point came on August 22. GBP/USD rallied significantly after the Fed Chair’s speech at Jackson Hole signaled a more accommodating policy stance.
Since that rally, the pair has moved sideways as markets wait for key economic reports before the Fed’s September meeting. At the time of this writing, GBP/USD is trading at 1.3496, representing a monthly gain of approximately 2.7%.
The AUD/USD pair experienced a volatile August, driven not only by US economic data but also by RBA policy and developments in China. As Australia’s economy is heavily dependent on Chinese demand, the Australian dollar is particularly sensitive to changes in the Chinese economy.
Similar to other major currency pairs, AUD/USD trended upward during the first two weeks of August. The month started with a sharp spike, fueled by a weaker-than-expected US Nonfarm Payrolls report on August 1 that weighed on the dollar. The pair’s momentum was further boosted by optimism about a potential US-China tariff deal.
Additional support came from Australia’s June trade balance data, which showed a surplus of 5,365 million, significantly exceeding the expected 3,250 million. The general weakness of the US dollar, following on-target CPI figures, also bolstered the Australian dollar and overshadowed the Reserve Bank of Australia’s 25-basis-point rate cut to 3.60%.
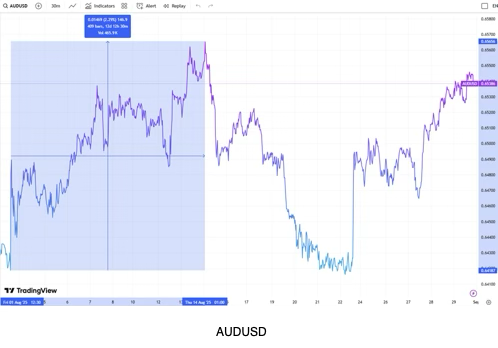
However, this rally was short-lived. The AUD/USD pair entered a downward trend between August 14 and 22, as the US dollar regained strength following stronger-than-expected PPI and PMI data. This economic data tempered expectations of a September Fed rate cut, thereby supporting the Greenback. The dollar’s gains were further solidified by a shift to a more defensive stance among traders, who became cautious due to rising geopolitical tensions and the highly anticipated Jackson Hole Symposium.
On August 22, the AUD/USD pair surged after the Fed Chair’s dovish comments at Jackson Hole, which triggered a significant sell-off of the dollar. The pair has continued to trend upward, supported by three main factors.
First, Australian inflation came in hotter than expected, with the Consumer Price Index (CPI) rising to 2.8% in July from 1.9% in June. This reduced the likelihood of an RBA rate cut.
Second, growing concerns about the Fed’s independence weighed on the US dollar.
Finally, the release of the US Personal Consumption Expenditures (PCE) Price Index on August 29, which met expectations, further solidified market bets on a September Fed rate cut and put more downward pressure on the dollar.
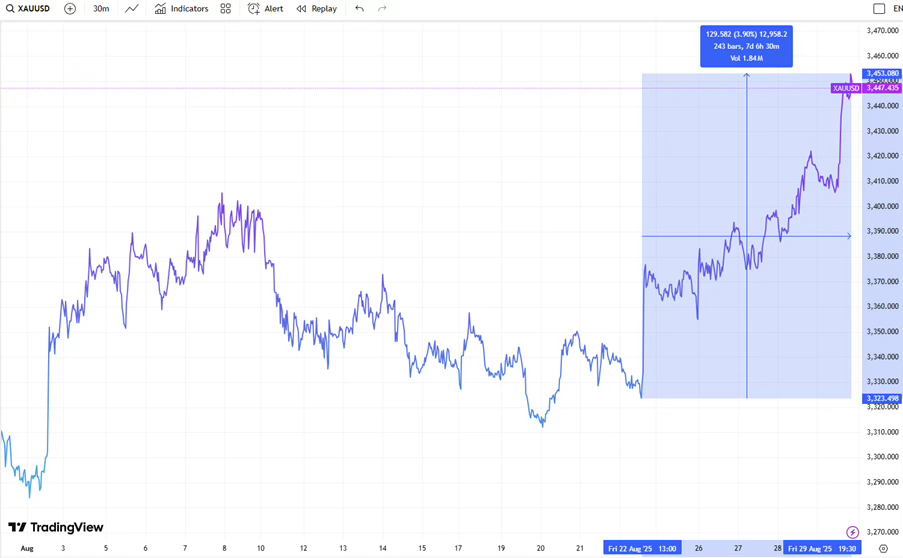
Gold (XAU/USD) had a strong rally in August, gaining over 5% and nearing its monthly high of $3,447.43 at the time of writing.
The precious metal started the month with a sharp rally, driven by a broad selloff of the US dollar following the weaker-than-expected US NFP report.
After this initial surge, the non-yielding asset entered a consolidation phase. It was held back by conflicting US economic data—softer-than-expected CPI figures were offset by stronger PPI and PMI data—and persistent uncertainty about the Federal Reserve’s future policy direction.
August 22 was a turning point for Gold. Fed Chair Powell’s dovish Jackson Hole speech signaled a potential start to the easing cycle at the September meeting. His remarks led to a sharp dollar selloff, which in turn set the stage for Gold’s continued rally.
This rally has been sustained by several factors: growing certainty about a September Fed rate cut; concerns about the Fed’s independence amid political pressure; and broader geopolitical uncertainties, which are driving “safe-haven” flows into Gold. The month-end release of the US PCE Price Index on August 29 further reinforced bets on a September rate cut, putting more pressure on the dollar and fueling additional inflows into the precious metal.
Looking ahead, the forex market is poised for strong directional moves in September. While markets are largely confident that the Fed will cut rates, this outlook could change with the release of two critical data points: the August Consumer Price Index (CPI) and Nonfarm Payrolls reports. If these reports show stronger-than-expected figures, the Fed might decide to delay its easing cycle, a move that would likely trigger significant volatility across the market.
System Breakdown
R-50
R-10
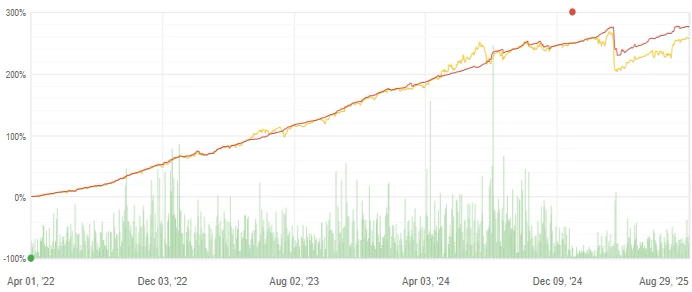
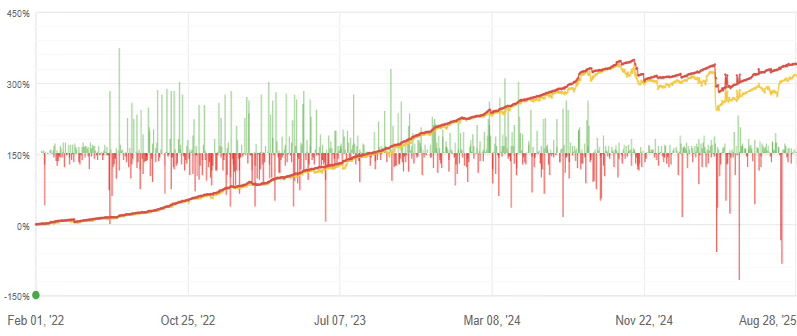
In a challenging environment marked by unclear market direction, R-50 and R-10 performed steadily in August, delivering 0.34% and 0.89%, respectively.
Both systems trade the same subsystems, with the R-10 applying a slight filter on smaller trades to accommodate a lower minimum deposit.
For R-50, EUR/USD long/short, XAU/USD long/short, and AUD/CAD long/short were the biggest profit contributors. In contrast, the NZD/CAD long/short and GBP/JPY long/short incurred the largest losses. Notably, the losing trades were executed at relatively low volumes.
Gains from EUR/USD and XAU/USD positions show the strategy’s ability to capture price swings in both directions. It effectively benefited from the mid-month consolidation as well as the sustained rallies that followed the Fed Chair’s Jackson Hole speech, which caused significant US dollar selloffs and was reinforced by factors supporting a September rate cut.
Meanwhile, R-10’s top contributors were XAU/USD, EUR/USD, and NZD/USD.
During the period, R-50 entered 2,064 trades with a win percentage of 59% and an average holding period of 1 day. R-10 entered 601 trades with a win percentage of 57% and an average holding period of 1 day.
All subsystems were reviewed and re-calibrated at the end of August to ensure consistency and optimal performance, especially in light of the current market conditions.
R-X25
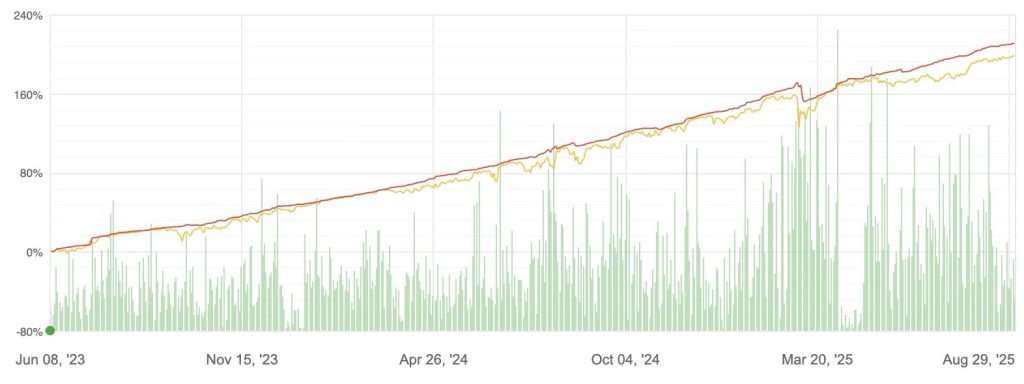
In an uncertain environment marked by market indecision, R-X25 delivered a decent return of 2.69% in August.
The system executed 1,261 trades, with a win percentage of 54% and an average holding period of approximately 24 hours. The Profit Factor stood at 2, reflecting good system-level efficiency amid chaotic market conditions.
EUR/USD long/short, GBP/USD long, and AUD/CAD long/short were the biggest profit contributors to the monthly performance. In contrast, GBP/CAD and GBP/JPY positions incurred losses.
The gains from the EUR/USD long and short positions demonstrate the strategy’s agility in capturing price movements in both directions. The system was effectively positioned to benefit from the mid-month consolidation with a downward bias and also to capitalize on the sustained rallies that followed the Fed Chair’s Jackson Hole speech, which triggered significant US dollar selloffs and was reinforced by factors supporting a September rate cut.
At the end of the month, the system’s main exposures were to AUD/NZD short, USD/CHF long, and EUR/CAD long.
All subsystems were thoroughly reviewed and re-calibrated at the end of July to ensure consistency and optimal performance, especially in light of the prevailing market conditions.
R-C30
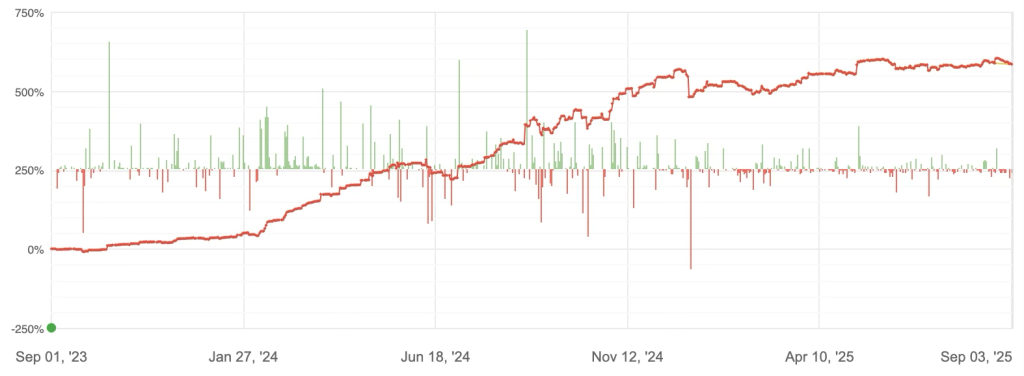
R-C30, which holds both long and short exposures across BTC/USD and ETH/USD, ended July with a mediocre average return of 2.55%.
The system’s activity increased, executing 533 trades with a win percentage of 83% and a short average holding period of only 8 hours and 33 minutes. The shorter holding periods reflect the choppy market environment, where the system was able to capture smaller and shorter swings.
The Profit Factor stood at 1.29, indicating good system-level efficiency. The month-to-date drawdown was also low at only 2.56% on equity, showing stability during this period.
Both BTC/USD and ETH/USD contributed to the P/L for August. However, ETH/USD’s contribution came mainly from its long exposure, while BTC/USD was negative on longs but delivered solid gains on shorts. This demonstrates the natural hedging of the system, where different trading approaches reduce the portfolio’s exposure to directional risks.
By the end of August, the system’s exposure was evenly distributed between ETH/USD and BTC/USD.
R-X5
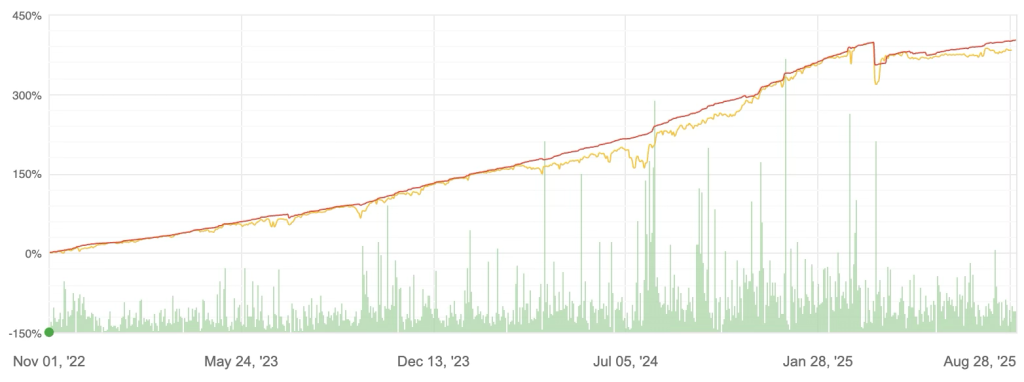
During a period of fairly tight and choppy markets in August, R-X5 delivered a return of 1.88%, highlighting the challenges of navigating such conditions.
The system executed 434 trades with a win percentage of 62% and an average holding period of 24 hours. The profit factor for August was 1.7.
EUR/USD long/short, CHF/JPY short, and GBP/USD long were the biggest contributors to the profit, while GBP/CAD and GBP/JPY were the only notable losers.
Gains from the EUR/USD long and short positions show the strategy’s ability to capitalize on both sides of the pair’s price swings. The system effectively benefited from the mid-month consolidation with a downward bias and also captured the sustained rally triggered by the Fed Chair’s Jackson Hole speech, which caused significant US dollar selloffs and was further supported by factors reinforcing expectations of a September rate cut.
By the end of August, the top three pairs in terms of exposure were AUD/NZD short, GBP/USD short, and AUD/USD long.
As per its monthly schedule, R-X5 has been fully reoptimized and adapted to the current market structures.